# Load necessary R packages for data processing and visualization
pkgs <- c("fs", "futile.logger", "configr", "stringr", "ggpubr", "ggthemes",
  "vroom", "jhtools", "glue", "openxlsx", "ggsci", "patchwork", "cowplot",
  "tidyverse", "dplyr", "ggalluvial")
for (pkg in pkgs){
  suppressPackageStartupMessages(library(pkg, character.only = T))
}

# Define project parameters
project <- "mm"
dataset <- "jilin"
species <- "human"
workdir <- glue::glue("~/projects/{project}/analysis/{dataset}/{species}/rnaseq/merge_compass") %>% checkdir()
setwd(workdir)17 Concordance of subtypes between CoMMpass subtypes and ours
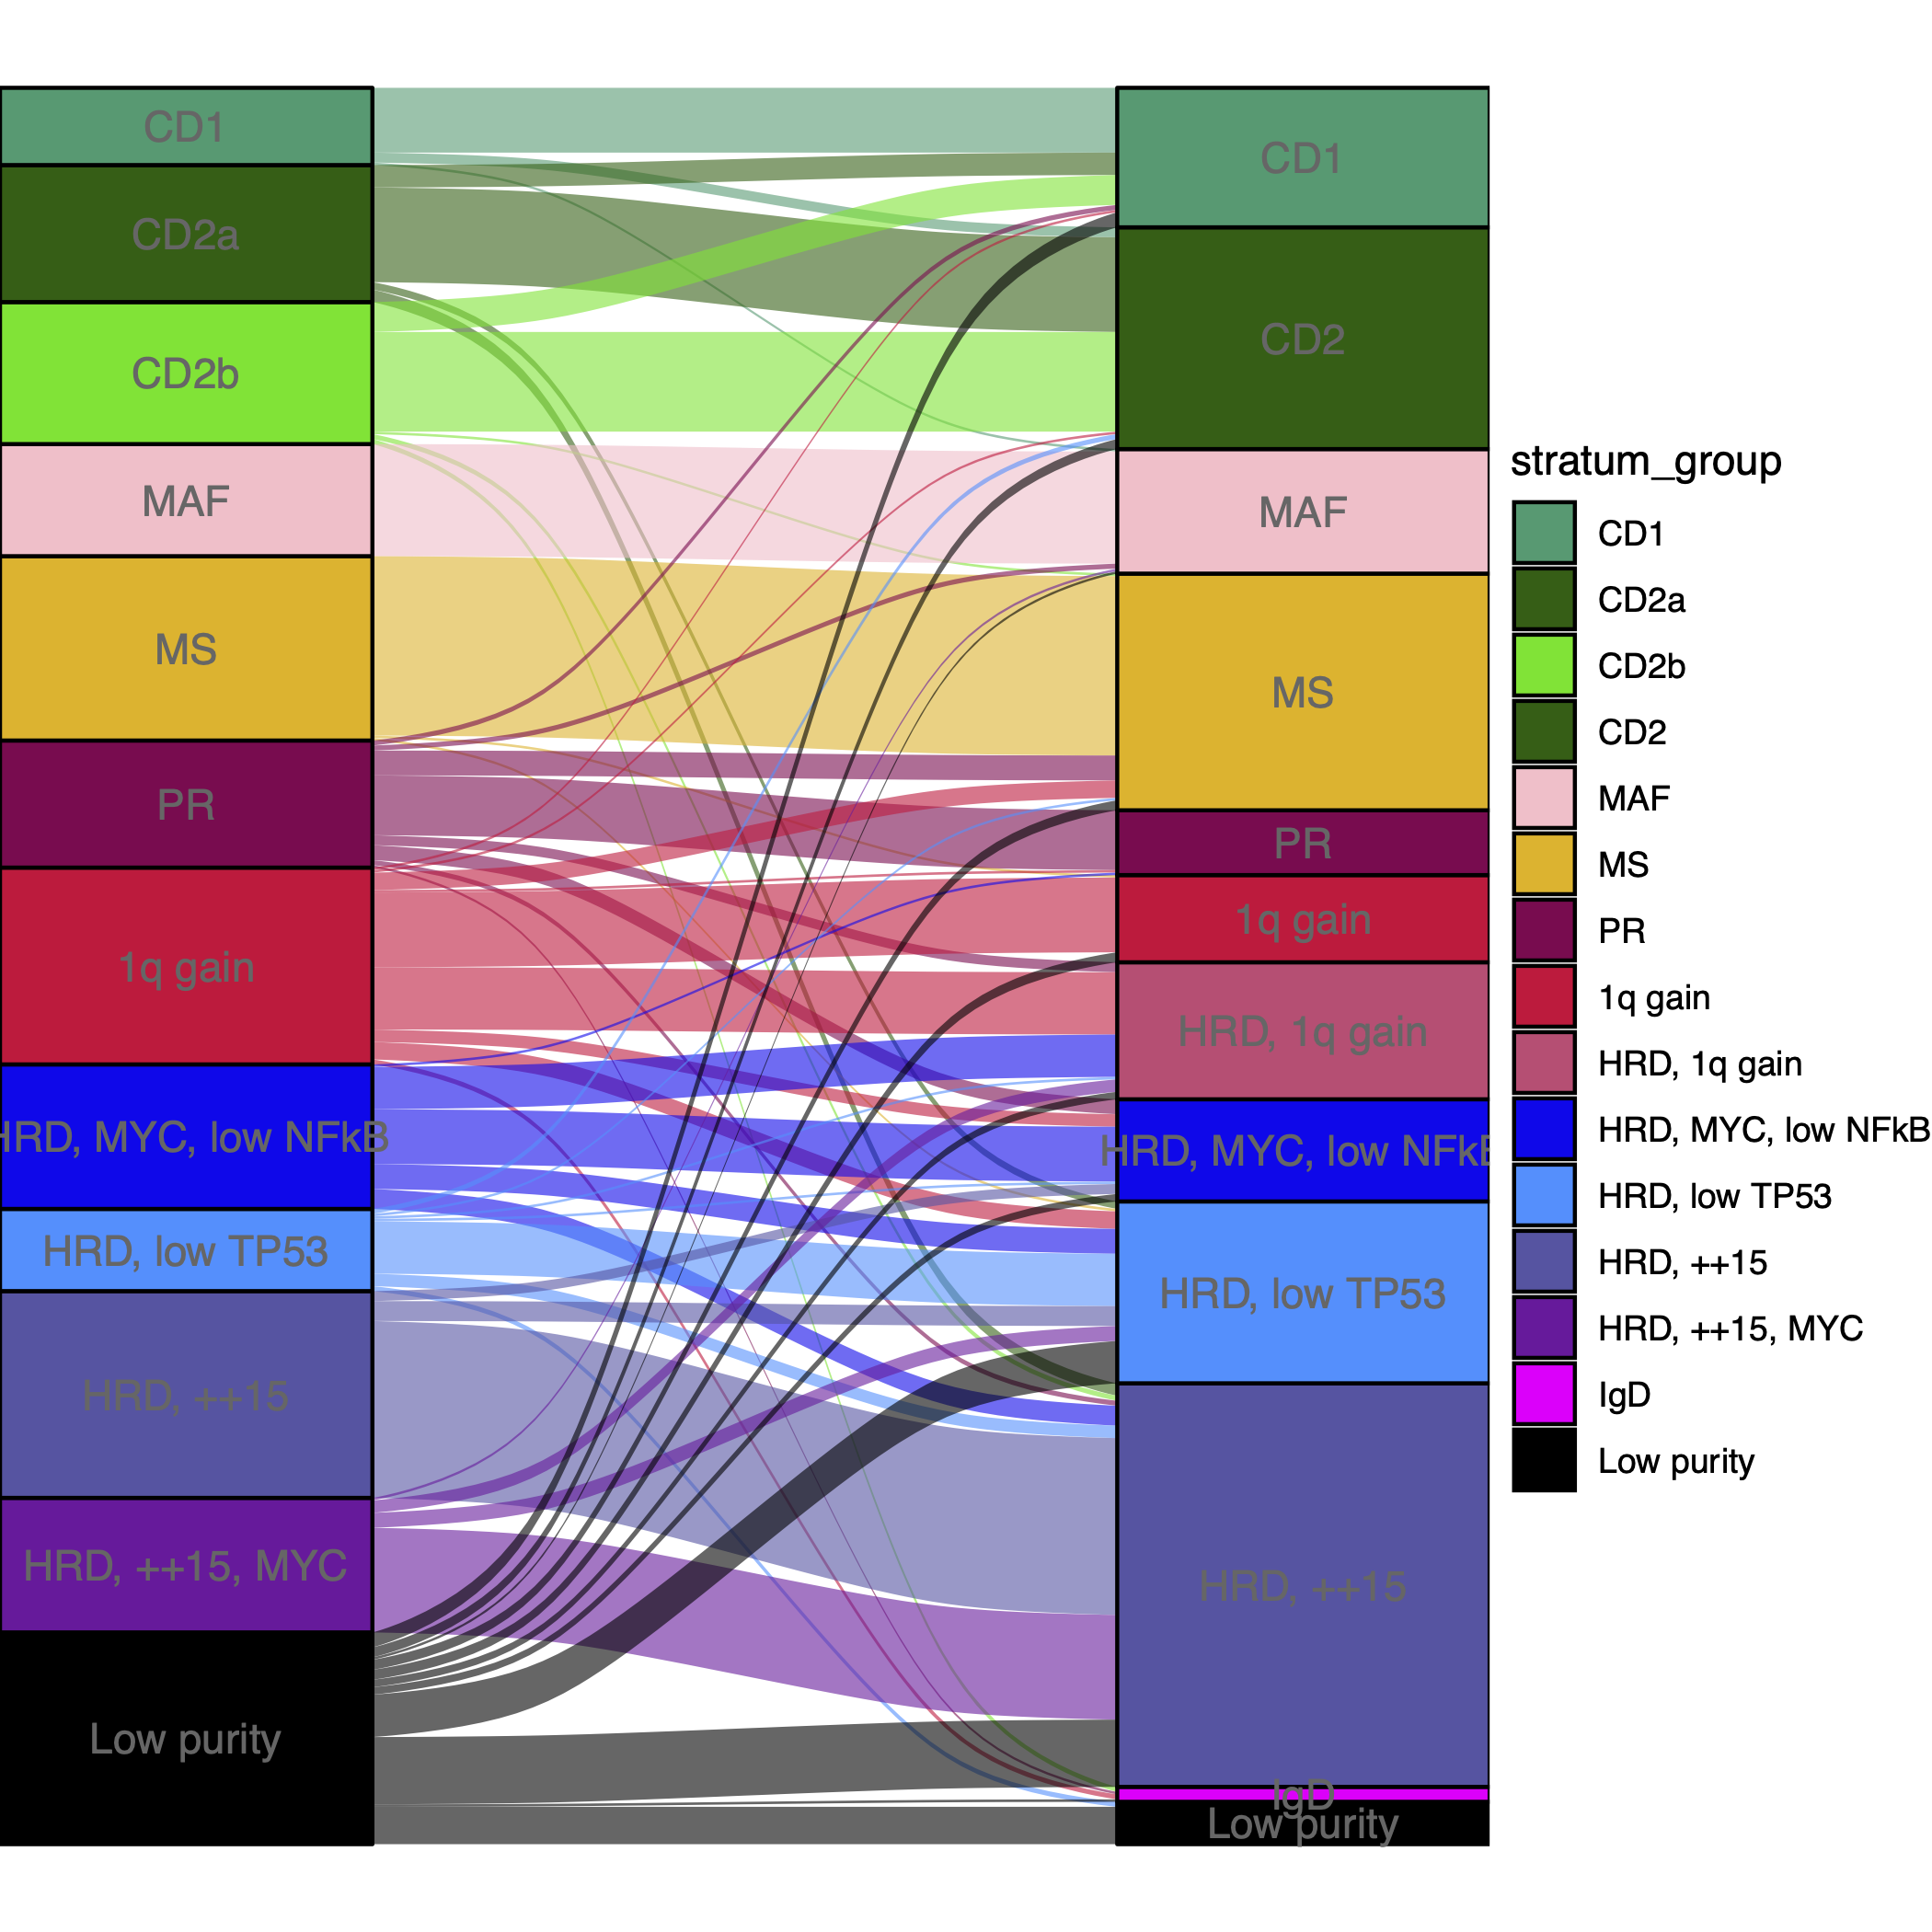
Skerget, S., etc. identified 12 unique subtypes of multiple myeloma by analysis of CoMMpass cohort (Comprehensive molecular profiling of multiple myeloma identifies refined copy number and expression subtypes, PMID: 39160255). Based on the combined results from the two-stage clustering on merged datasets, we also annotated a total of 12 distinct groups. Therefore, we ploted an alluvial plot to evaluate concordance of subtypes between CoMMpass subtypes and ours.
17.1 Setup
Load required R packages and set the working directory.
17.2 Data Loading
Load sample info of all merged samples.
# Load merged sample info
sample_info <- "/cluster/home/jhuang/projects/mm/docs/meta/sampleinfo/sampleinfo_jilin_commpass.rds" %>% read_rds
17.3 Alluvial Plot
# Extract data for alluvial plots
sinfo_sub <- sample_info %>% dplyr::filter(!duplicated(sample_id)) %>% dplyr::filter(subtypes %notin% "")
plot_subt <- sinfo_sub %>% dplyr::select(sample_id, subtypes, RNA_Subtype_Name) %>%
  dplyr::count(subtypes, RNA_Subtype_Name) %>% drop_na(RNA_Subtype_Name)

# Convert to alluvial format
plot_lodes <- plot_subt %>%
  clusterProfiler::rename(axis1 = RNA_Subtype_Name, axis2 = subtypes) %>%
  ggalluvial::to_lodes_form(axes = 1:2, key = "axis", value = "stratum")

plot_lodes <- plot_lodes %>%
  dplyr::mutate(stratum_group = stratum)

plot_lodes <- plot_lodes %>%
  dplyr::mutate(stratum = case_when(
    stratum %in% c("1q gain") ~ "1qGain",
    TRUE ~ as.character(stratum)
  ))

plot_lodes$stratum <- factor(plot_lodes$stratum,
                             levels = c("CD1", "CD1 RUNX2", "CD2a", "CD2b", "CD2",
                                        "MAF", "MS", "PR", "1qGain",
                                        "HRD, +1q", "HRD, MYC, low NFkB",
                                        "HRD, low TP53", "HRD, ++15",
                                        "HRD, ++15, MYC", "IgD enriched", "Low purity"))

plot_lodes <- plot_lodes %>%
  dplyr::mutate(stratum_group = case_when(
    stratum_group %in% c("1q gain") ~ "1qGain",
    TRUE ~ as.character(stratum_group)
  ))

plot_lodes$stratum_group <- factor(plot_lodes$stratum_group,
                                   levels = c("CD1", "CD1 RUNX2", "CD2a", "CD2b", "CD2",
                                        "MAF", "MS", "PR", "1qGain",
                                        "HRD, +1q", "HRD, MYC, low NFkB",
                                        "HRD, low TP53", "HRD, ++15",
                                        "HRD, ++15, MYC", "IgD enriched", "Low purity"))


# Define colors for subtypes
config_fn = "/cluster/home/jhuang/projects/mm/analysis/jilin/human/rnaseq/configs/colors.yaml"
col_rnasubtype <- show_me_the_colors(config_fn, "RNA_Subtype_Name")
col_subt <- show_me_the_colors(config_fn, "subtypes")

fill_colors <- c(col_subt, col_rnasubtype)

p <- ggplot(plot_lodes,
            aes(x = axis, stratum = stratum, alluvium = alluvium, y = n)) +
  geom_flow(aes(fill = stratum_group), alpha = 0.6) +
  geom_stratum(aes(fill = stratum_group), width = 1/3) +
  geom_text(stat = "stratum", aes(label = after_stat(stratum)), color = "gray40") +
  scale_x_discrete(
    limits = c("axis1", "axis2"),
    labels = c("Subtypes", "RNA Subtype"),
    expand = c(0.01, 0.01)
  ) +
  scale_fill_manual(values = fill_colors) +
  theme_void()
ggsave("commpass_rna_subtype_subtypes_new.pdf", p)