pkgs <- c("fs", "futile.logger", "configr", "stringr", "ggpubr", "ggthemes",
          "jhtools", "glue", "ggsci", "cowplot", "patchwork", "tidyverse",
          "circlize", "grid", "gplots", "ggrepel", "ComplexHeatmap",
          "GenomicRanges", "jhuanglabRNAseq", "ggh4x", "gghalves"
          )
for (pkg in pkgs){
  suppressPackageStartupMessages(library(pkg, character.only = T))
}

# Define project parameters
project <- "mm"
dataset <- "meta"
species <- "human"
workdir <- glue("~/projects/{project}/output/{dataset}/{species}/figures/fig2") |> checkdir()
setwd(workdir)32 Figure 2
32.1 Figure 2
32.2 Setup
Load required R packages and set the working directory.
32.3 overview of mutations
# load cnv data
band_data <- read.delim("/cluster/home/yjliu_jh/projects/leukemia/data/common/cytoBand_hg38.txt", header = F)
colnames(band_data) <- c("chr", "start", "end", "band", "stain_value")
band_data <- band_data[nchar(band_data$chr) <= 5, ]

m_cnv_band <- read_rds("../merged_cnv_band_circos.rds")
m_cnv_band_fil <- m_cnv_band[!grepl("C$", m_cnv_band$sample_id), ]
sample_count <- length(unique(m_cnv_band_fil$sample_id))
stat_cnv_band <- m_cnv_band_fil %>% group_by(chr, band, bivalue) %>% summarise(prop = n() / sample_count)
stat_cnv_band <- left_join(stat_cnv_band, band_data[, 1:4])
gain_df <- stat_cnv_band[stat_cnv_band$bivalue %in% 1, ]
loss_df <- stat_cnv_band[stat_cnv_band$bivalue %in% -1, ]
gain_df$value <- gain_df$prop
loss_df$value <- loss_df$prop
gain_df <- gain_df[, c("chr", "start", "end", "value")]
loss_df <- loss_df[, c("chr", "start", "end", "value")]

# load mut data (may alter later)
merged_mutations <- read_rds("../merged_mutations_circos.rds")

merged_mutations <- merged_mutations[!grepl("C$", merged_mutations$sample_id), ]
sample_count2 <- length(unique(merged_mutations$sample_id))
stat_mut <- merged_mutations %>% group_by(chr, start, end) %>% summarise(value = n() / sample_count2)
mutation_df <- as.data.frame(stat_mut)
mutation_df <- mutation_df[mutation_df$value %notin% min(mutation_df$value), ]
mutation_df <- mutation_df[mutation_df$value %notin% min(mutation_df$value), ]

col_fun <- colorRamp2(
  c(min(mutation_df$value, na.rm = TRUE),
    median(mutation_df$value, na.rm = TRUE),
    max(mutation_df$value, na.rm = TRUE)),
  c("steelblue", "yellow2", "tomato")
)

# load label data
label_df <- read_rds("../white_list_label_circos.rds") %>%
  dplyr::filter(!chr %in% c("chrX"))

legend_obj <- ComplexHeatmap::Legend(
  col_fun = col_fun,
  title = "Mutation Frequency",
  direction = "horizontal",
  legend_width = unit(4, "cm"),
  title_position = "topcenter"
)


# plot

pdf("figure2_circos_plot_hg38.pdf", width = 8, height = 8)

circos.clear()

circos.par(start.degree = 90, "canvas.ylim" = c(-1.25, 1.25))
circos.initializeWithIdeogram(
  species = "hg38",
  chromosome.index = paste0("chr", c(1:22)),
  plotType = "none"
)
circos.genomicLabels(
  label_df,
  labels.column = 4,
  side = "outside",
  connection_height = mm_h(5),
  line_col = "grey30",
  cex = 0.5,
  labels_height = mm_h(3)
)

circos.clear()
par(new = TRUE)

circos.par(
  start.degree = 90,
  gap.degree = 1,
  track.margin = c(0.01, 0.01),
  canvas.ylim = c(-1.5, 1.5)
)

# ======= initialization =======
circos.initializeWithIdeogram(
  species = "hg38",
  chromosome.index = paste0("chr", c(1:22)),
  plotType = c("ideogram", "labels"),
  ideogram.height = 0.04,
  track.height = 0.02
)


# ======= Track 3: mutation =======
circos.genomicTrack(mutation_df,
                    track.height = 0.1,
                    bg.border = NA,
                    ylim = c(0, 1),
                    panel.fun = function(region, value, ...) {
                      circos.segments(region[[1]], 0, region[[2]], 1,
                                      col = col_fun(value[[1]]), lwd = 1)
                    })

# ======= Track 1: cn gain =======
circos.genomicTrack(gain_df,
                    track.height = 0.12,
                    bg.border = NA,
                    ylim = c(0, max(gain_df$value, na.rm = TRUE)),
                    panel.fun = function(region, value, ...) {
                      circos.rect(xleft  = region[[1]],
                                  ybottom = 0,
                                  xright = region[[2]],
                                  ytop   = value[[1]],
                                  col = "#E04477",
                                  border = NA)
                    })

# ======= Track 2: cn loss =======
circos.genomicTrack(loss_df,
                    track.height = 0.12,
                    bg.border = NA,
                    ylim = c(0, max(loss_df$value, na.rm = TRUE)),
                    panel.fun = function(region, value, ...) {
                      circos.rect(xleft  = region[[1]],
                                  ybottom = value[[1]],
                                  xright = region[[2]],
                                  ytop   = 0,
                                  col = "#55CC33",
                                  border = NA)
                    })


# ======= Track 4: label =======


# ======= center legend =======
pushViewport(viewport(x = 0.5, y = 0.65, width = 0.1, height = 0.1, just = c("center", "center")))
grid.text("Legend", y = 0.8, gp = gpar(fontsize = 10, fontface = "bold"))
grid.text("Red: Amplification", y = 0.6, gp = gpar(col = "#E04477", fontsize = 8))
grid.text("Green: Deletion", y = 0.4, gp = gpar(col = "#55CC33", fontsize = 8))
grid.text("Labeled: Selected genes", y = 0.2, gp = gpar(fontsize = 8))
popViewport()


pushViewport(viewport(x = 0.5, y = 0.4))
grid.draw(legend_obj)
popViewport()

dev.off()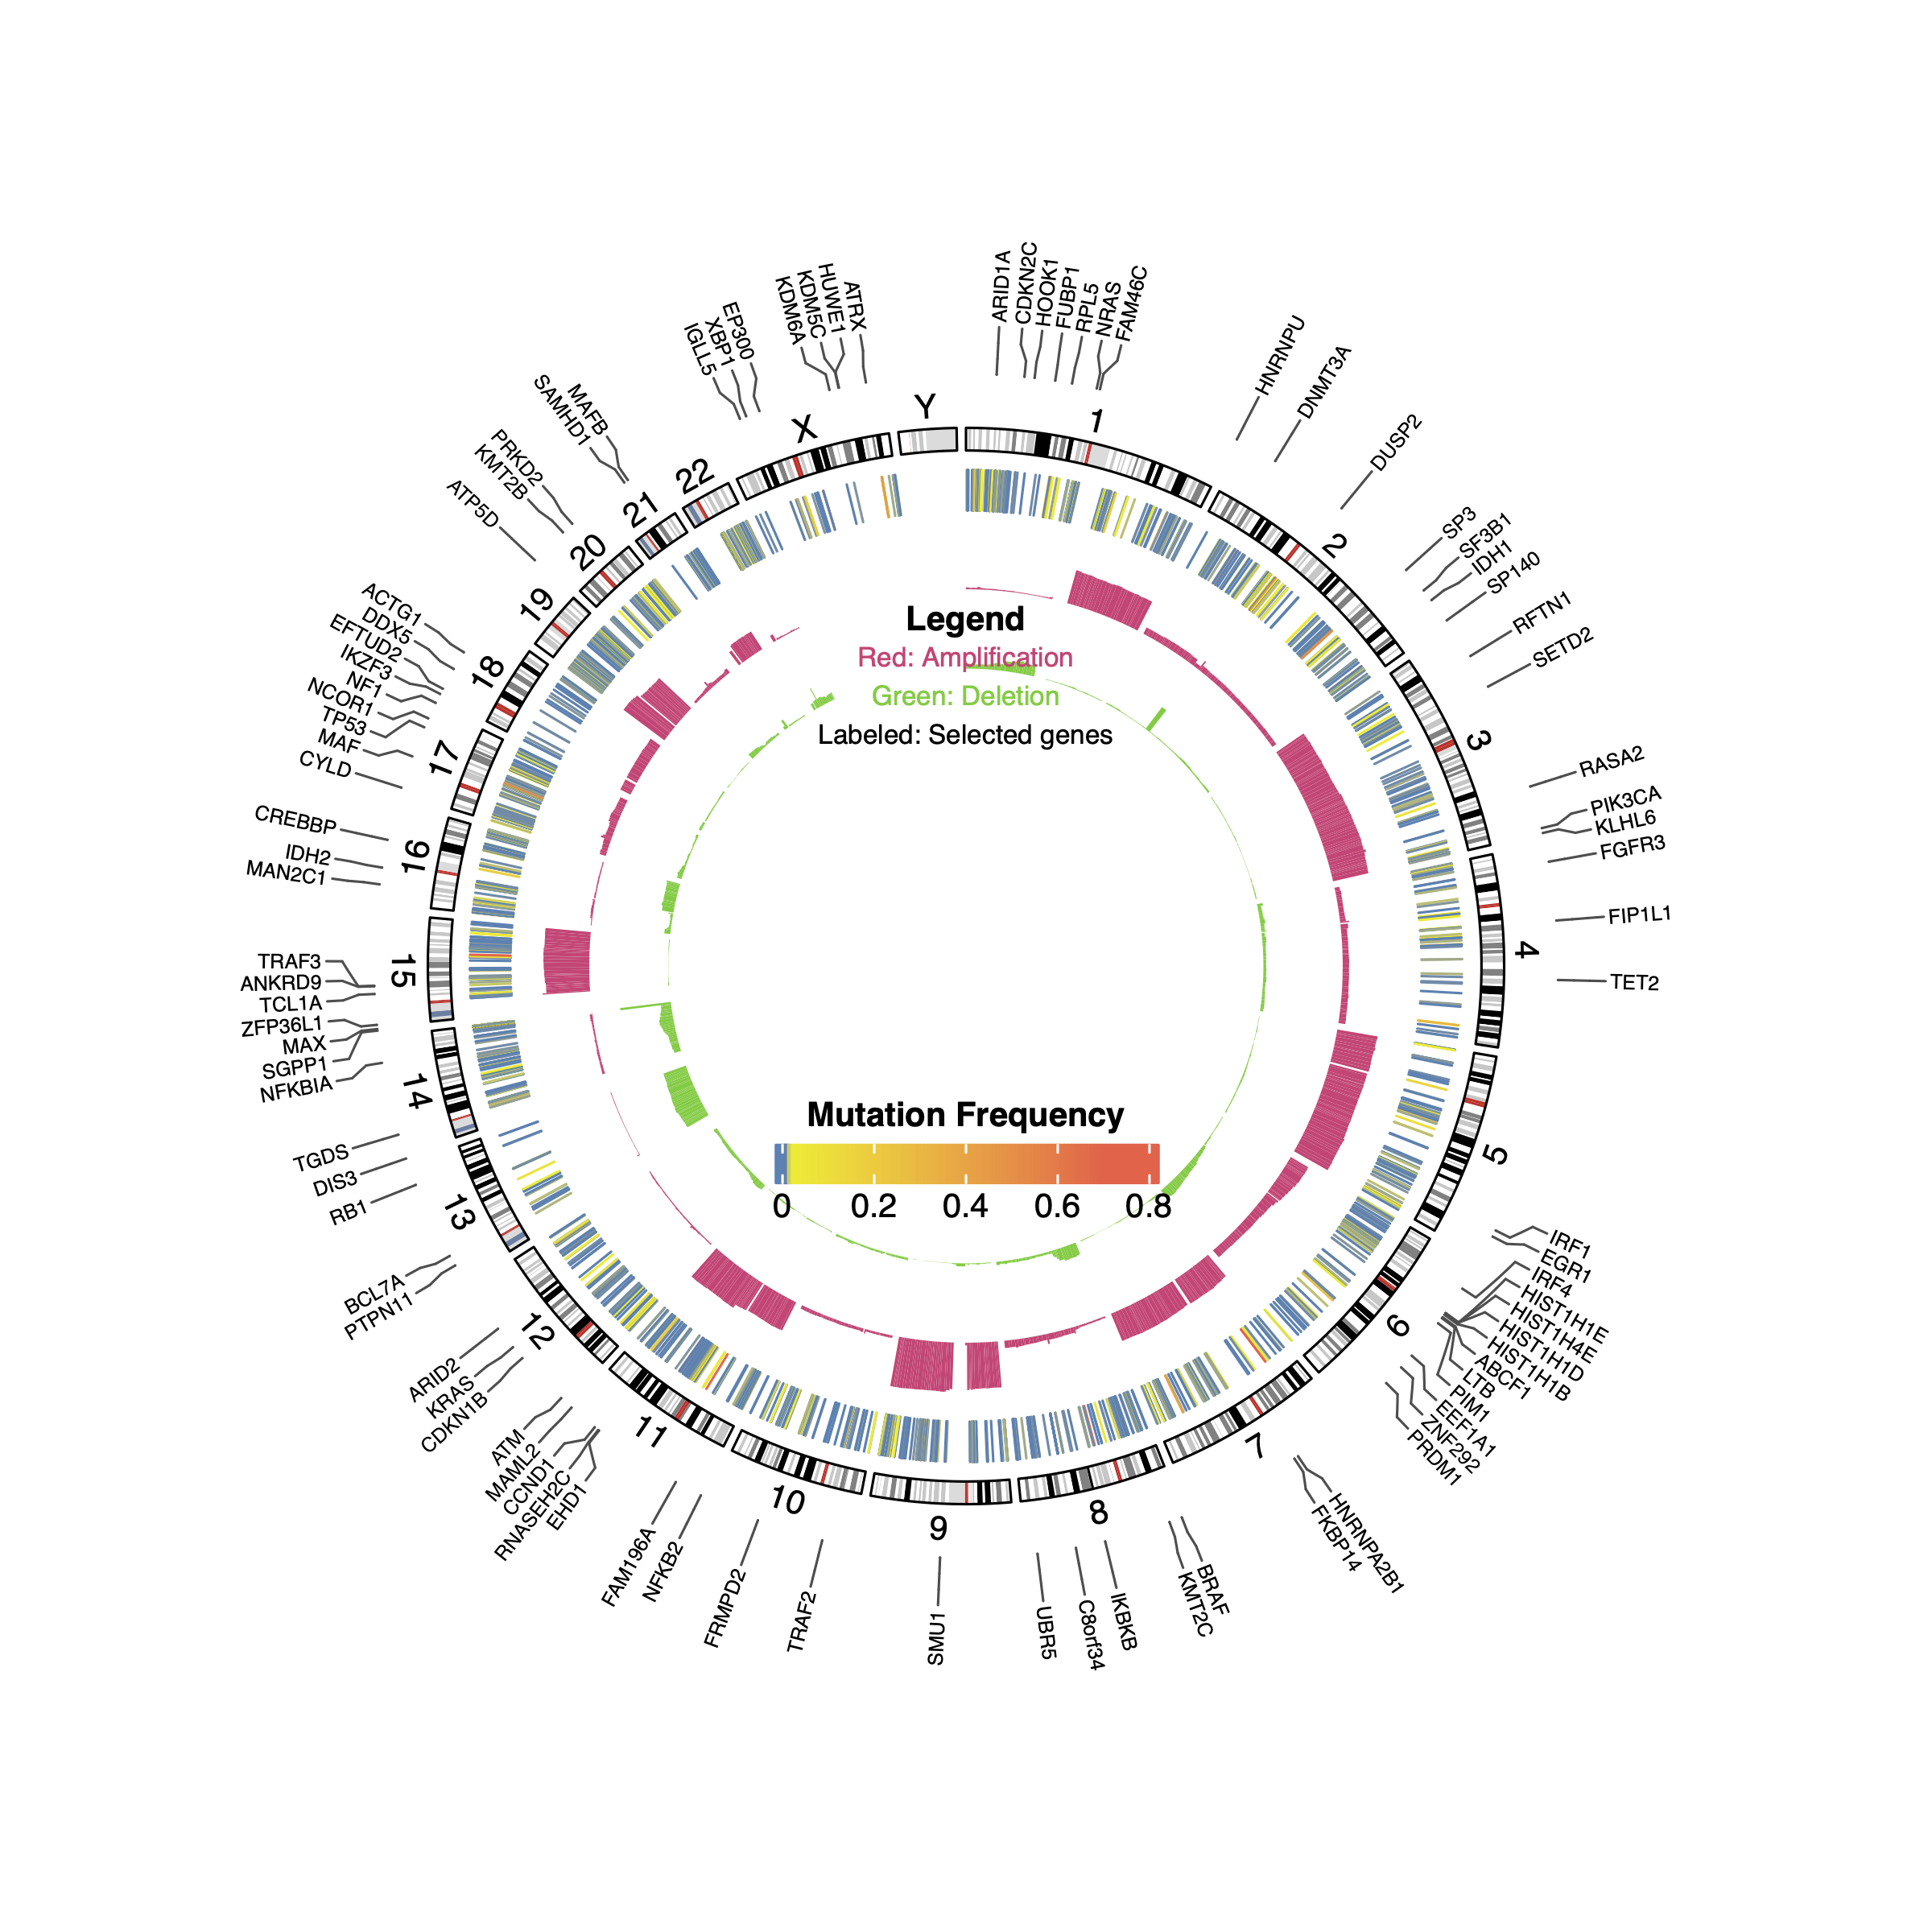
32.4
input_df <- read_rds("/cluster/home/yjliu_jh/projects/mm/data/output/sv/sv_chord_input.rds")
chord_data <- input_df %>% group_by(pair) %>% mutate(freq = n()) %>% dplyr::select(-sample_id) %>%
  distinct() %>% as.data.frame()
chord_data <- chord_data[chord_data$freq >= 3, ]
trans_df <- chord_data %>%
  mutate(
    end1 = ifelse(end1 == start1, end1 + 1, end1),
    end2 = ifelse(end2 == start2, end2 + 1, end2)
  )
trans_df$start1[trans_df$start1 == 0] <- 1
trans_df$start2[trans_df$start2 == 0] <- 1

pdf("figure2_circos_sv_trans_test.pdf", width = 8, height = 8)

circos.clear()
circos.par("track.height" = 0.05)
circos.initializeWithIdeogram(species = "hg38")

bed1 <- trans_df[, c("chr1", "start1", "end1")]
bed2 <- trans_df[, c("chr2", "start2", "end2")]
maxf <- max(trans_df$freq)
col_fun <- colorRamp2(c(1, maxf), c("lightblue", "red"))
cols <- col_fun(trans_df$freq)
scaled <- scales::rescale(trans_df$freq, to = c(0.1, 1))
scaled_255 <- round(scaled * 255)
hex_vals <- toupper(sprintf("%02X", scaled_255))
cols <- paste0(substr(cols, 1, 7), hex_vals)
circos.genomicLink(bed1, bed2,
                   col = cols,
                   border = NA)
dev.off()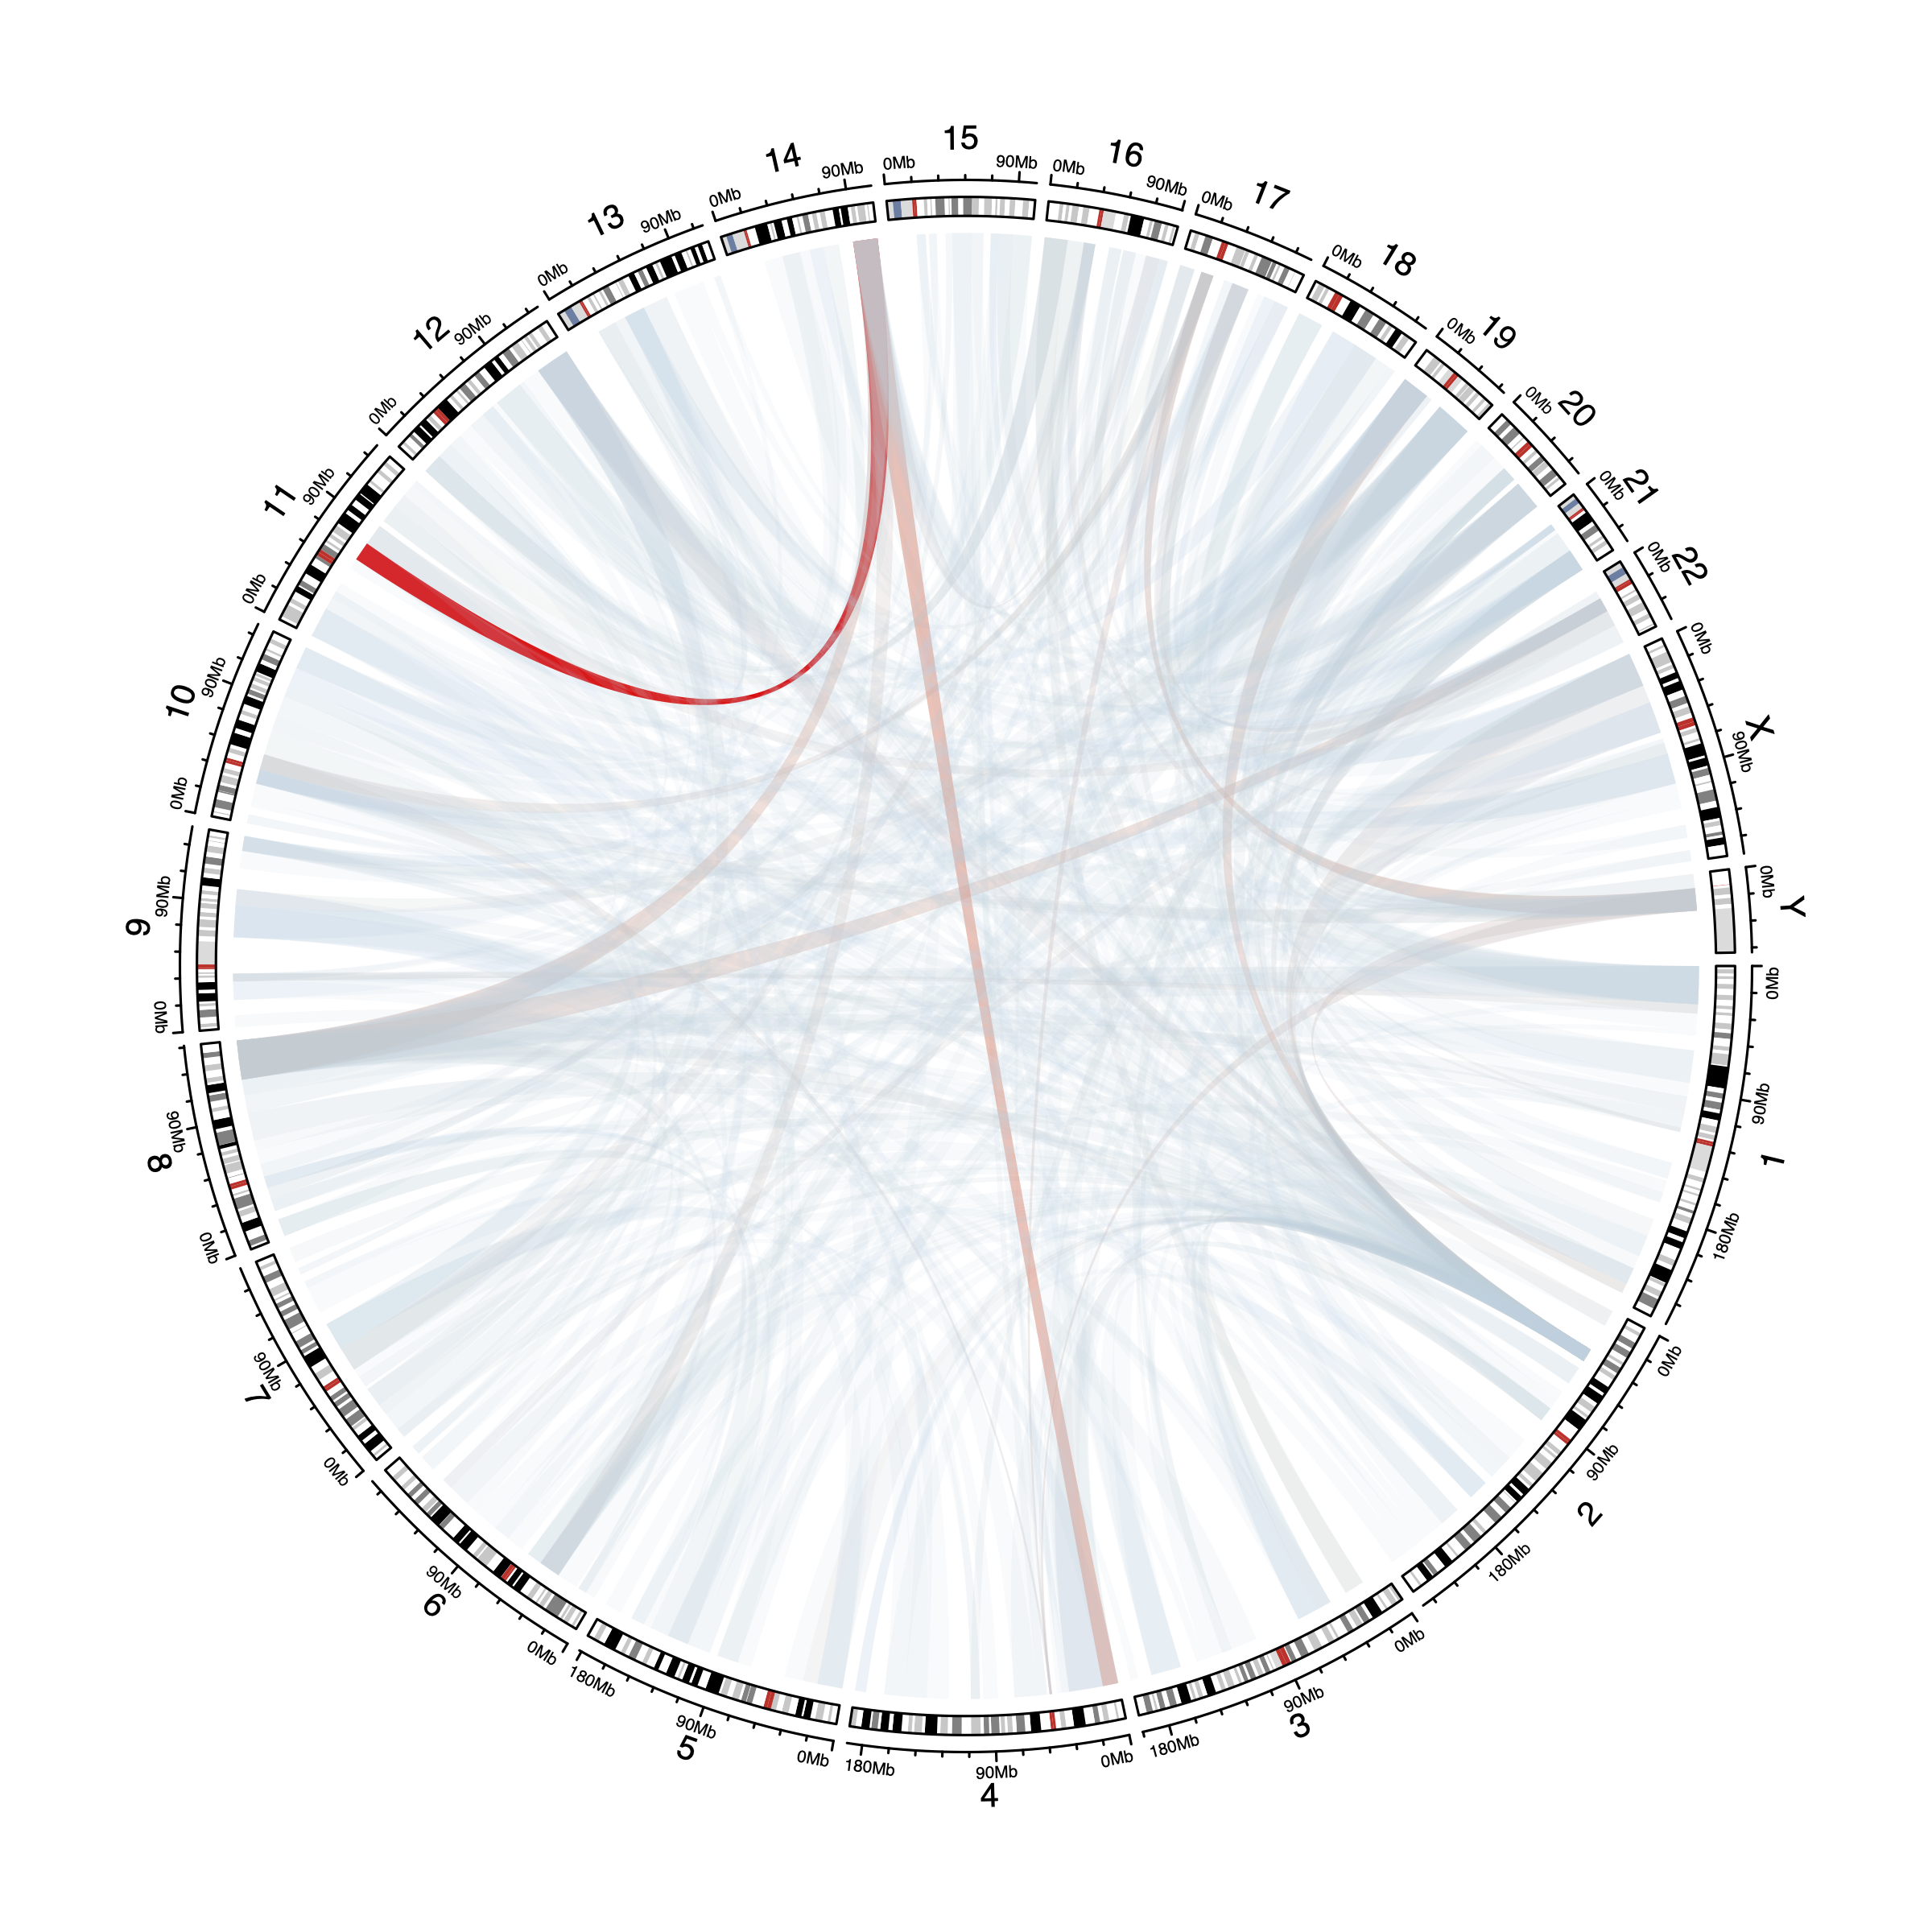
32.5 heatmap of mutations
# load data
objht <- read_rds("/cluster/home/jhuang/projects/mm/analysis/meta/human/rnaseq/figures/heatmap/step1/heatmap_0.9_groups16.rds")
df <- read_rds("/cluster/home/jhuang/projects/mm/docs/meta/sampleinfo/sampleinfo_jilin_commpass.rds")
config_fn <- "~/projects/mm/output/meta/human/figures/colors_fix.yaml"
config_list <- show_me_the_colors(config_fn, "all")

# subset data
subdf <- tibble(sample_id = rownames(objht$heatmap2[[6]])) |>
  left_join(df) |>
  mutate(
    hit_event = str_extract(hit_event, pattern = "\\d+"),
    best_response = case_when(
      best_response == "SCR" ~ "sCR",
      best_response == "≥VGPR" ~ "VGPR",
      T ~ best_response
    )
  )

# color settings
col <- config_list[c("gender", "ethnicity", "age", "GEP70", "Clinical_IgH", "Clinical_IgL", "batch", "subtypes", "imwg_risk",
                     "treatment_group", "best_response", "hit_event")]
col$ethnicity <- c(col$ethnicity, "other" = "grey")
col$datasets <- config_list$batch
col$GEP70 <- colorRamp2(quantile(subdf$GEP70, c(0.1, 0.5, 0.9), na.rm = TRUE),
                        colors = col$GEP70[c("colors1", "colors2", "colors3")])
col$age <- colorRamp2(quantile(subdf$age, as.numeric(col$age[c("breaks1", "breaks2", "breaks3")]), na.rm = TRUE),
                      colors = col$age[c("colors1", "colors2", "colors3")])

out_dir <- dir_create("./mutations_heatmap/")

# draw
genes <- config_list$expression_order
igv <- str_c("Tx_", config_list$igtx_order)
# cnvlevels <- config_list$cnv_order |> str_c("_fish")
cnvlevels <- config_list$cnv_order

ft <- subdf$datasets %in% c("commpass", "jilin")
mm_heatmap <- "/cluster/home/jhuang/projects/mm/analysis/meta/human/rnaseq/exp/mm_heatmap1117.rds" %>%
  read_rds() |> convert_df_plot()

make_cnvdf <- function(annotated_longmatrix){
  annotated_longmatrix <- annotated_longmatrix |> mutate(pq = str_extract(band, pattern = "[pq]"))
  df1 <- annotated_longmatrix |>
    dplyr::filter(str_detect(sample_id, pattern = "T$")) |>
    group_by(chr_gene, pq, sample_id) |> summarise(log2 = mean(log2)) |>
    ungroup() |> mutate(sample_id = str_remove(sample_id, pattern = "T$"),
                        cnvtype = case_when(
                          log2 > 0.2 ~ "Gain",
                          log2 < - 0.2 ~ "Del",
                          T ~ "Normal"
                        )) |>
    pivot_wider(id_cols = sample_id, names_from = c(chr_gene, pq), values_from = cnvtype, names_sep = "")

  df2 <- annotated_longmatrix |>
    dplyr::filter(str_detect(sample_id, pattern = "T$")) |>
    group_by(chr_gene, sample_id) |> summarise(log2 = mean(log2))|>
    ungroup() |> mutate(sample_id = str_remove(sample_id, pattern = "T$"),
                        cnvtype = case_when(
                          log2 > 0.2 ~ "Gain",
                          log2 < - 0.2 ~ "Del",
                          T ~ "Normal"
                        )) |>
    pivot_wider(id_cols = sample_id, names_from = chr_gene, values_from = cnvtype)
  df1 |> full_join(df2)
}

# gene expression
joinedf <- subdf[ft, "sample_id"] |>
  left_join(t(mm_heatmap[genes, ]) |> as_tibble(rownames = "sample_id")) |>
  mutate(sample_id = factor(sample_id, levels = sample_id))

# IG translocations
bcf_list_filted_subanno <- "/cluster/home/ztao_jh/projects/mm/analysis/meta/human/figures/heatmap/check_new_cluster_addsamples/check20250623/jilin_igtx.rds" |> read_rds()
bcf_list_filted_subanno <- subdf |> left_join(bcf_list_filted_subanno)
for(i in c("Tx_NSD2", "Tx_FGFR3", "Tx_CCND1", "Tx_CCND2", "Tx_CCND3", "Tx_MAF", "Tx_MAFA", "Tx_MAFB", "Tx_MYC" )){
  bcf_list_filted_subanno[[i]] <- subdf[[i]]|bcf_list_filted_subanno[[i]]
}
bcf_list_filted_subanno$"Tx_NSD2/FGFR3" <- bcf_list_filted_subanno$Tx_NSD2
bcf_list_filted_subanno$"Tx_NSD2/FGFR3"[is.na(bcf_list_filted_subanno$Tx_NSD2)] <- bcf_list_filted_subanno$Tx_FGFR3[is.na(bcf_list_filted_subanno$Tx_NSD2)]

# CNV
jilin_cnvdf <- "/cluster/home/ztao_jh/projects/mm/analysis/meta/human/rnaseq/figures/heatmap/cnv_rnaclusterenrich_used/annotated_longmatrix_jilin.rds" |> read_rds()
commpass_cnvdf <- "/cluster/home/ztao_jh/projects/mm/analysis/meta/human/rnaseq/figures/heatmap/cnv_rnaclusterenrich_used/annotated_longmatrix_commpass.rds" |> read_rds()
colnames(commpass_cnvdf)[2] <- "chr_gene"
commpass_cnvdf$sample_id <- paste0(commpass_cnvdf$sample_id, "T")

jilin_cnvdf0 <- make_cnvdf(jilin_cnvdf)
commpass_cnvdf0 <- make_cnvdf(commpass_cnvdf)
full_cnvdf <- subdf |>
  dplyr::select(sample_id) |>
  left_join(list(jilin_cnvdf0, commpass_cnvdf0) |> list_rbind())
for(i in cnvlevels){
  ftcnv <- is.na(full_cnvdf[[i]])&(!is.na(subdf[[glue("{i}_fish")]]))
  full_cnvdf[[i]][ftcnv] <- case_when(
    subdf[[glue("{i}_fish")]][ftcnv] == 1 ~ "Gain",
    subdf[[glue("{i}_fish")]][ftcnv] == -1 ~ "Del",
    subdf[[glue("{i}_fish")]][ftcnv] == 0 ~ "Normal"
  )
}

# mutations
wd_mutation_clean <- "/cluster/home/ztao_jh/projects/mm/analysis/meta/human/figures/heatmap/check_new_cluster_addsamples/check20250623/fig2/checkmutation/samtools_merge_mut_hotspots.rds" |>
  read_rds()
small_label <- read_rds("/cluster/home/ztao_jh/projects/mm/analysis/meta/human/figures/heatmap/check_new_cluster_addsamples/check20250623/commpass_wd_mutation_clean_small_label_raw.rds")
small_label_fix <- read_rds("/cluster/home/ztao_jh/projects/mm/analysis/meta/human/figures/heatmap/check_new_cluster_addsamples/check20250623/commpass_wd_mutation_clean_small_label.rds")

#
p1 <- subdf[ft, c("sample_id", "subtypes")] |>
  mutate(sample_id = factor(sample_id, levels = sample_id)) |>
  pivot_longer(-sample_id, names_to = "name", values_to = "subtypes") |>
  ggplot(aes(sample_id, name, fill = subtypes)) +
  geom_tile() +
  scale_fill_manual(values = col$subtypes, guide = guide_legend(ncol = 3)) +
  scale_y_discrete(expand = expansion(mult = c(0, 0))) +
  ylab("Annotation") +
  theme_few() +
  theme(axis.text.x = element_blank(), axis.title.x = element_blank(),
        axis.text.y = element_text(color = "black"), axis.ticks.length.x = unit(0, "mm"),
        legend.position = "right", plot.margin = margin(b = 0),
        panel.border = element_rect(fill = NA, color = "black", size = 0.5))

p2 <- joinedf |>
  pivot_longer(-sample_id) |>
  group_by(name) |>
  mutate(value = scale(value)[,1],
         value = pmax(pmin(value, 2), -2),
         name = factor(name, levels = rev(genes))) |>
  ggplot(aes(sample_id, name, fill = value)) +
  geom_tile() +
  scale_fill_gradient2(low = "#1E90FF", high = "#DC143C",
                       name = "Expression", guide = guide_colorbar(direction = "vertical")) +
  scale_y_discrete(expand = expansion(mult = c(0, 0))) +
  ylab("Expression") +
  theme_few() +
  theme(axis.text.x = element_blank(), axis.title.x = element_blank(),
        axis.text.y = element_text(color = "black"), axis.ticks.length.x = unit(0, "mm"),
        legend.position = "right", plot.margin = margin(b = 0, t = 0),
        panel.border = element_rect(fill = NA, color = "black", size = 0.5))

p3 <- bcf_list_filted_subanno[ft, c("sample_id", igv)] |>
  mutate(sample_id = factor(sample_id, levels = sample_id)) |>
  pivot_longer(-sample_id) |>
  mutate(name = factor(str_remove(name, "Tx_"), levels = rev(str_remove(igv, "Tx_"))),
         value2 = case_when(is.na(value) ~ "NA", value ~ "TRUE", TRUE ~ "FALSE")) |>
  ggplot(aes(sample_id, name, fill = value2)) +
  geom_tile() +
  scale_fill_manual(values = config_list$Igtrans_color,
                    name = "Ig trans", guide = guide_legend(ncol = 1)) +
  scale_y_discrete(expand = expansion(mult = c(0, 0))) +
  ylab("Ig translocations") +
  theme_few() +
  theme(axis.text.x = element_blank(), axis.title.x = element_blank(),
        axis.text.y = element_text(color = "black"), axis.ticks.length.x = unit(0, "mm"),
        legend.position = "right", plot.margin = margin(t = 0),
        panel.border = element_rect(fill = NA, color = "black", size = 0.5))

p4 <- subdf[ft,] |>
  dplyr::select(sample_id) |>
  left_join(wd_mutation_clean) |>
  pivot_longer(-sample_id) |>
  mutate(
    name = str_remove(name, pattern = "_other"),
    sample_id = factor(sample_id, levels = rownames(objht$heatmap2[[6]])),
    name = factor(name,
                  levels = unique(rev(small_label))),
    mutation_type = case_when(
      is.na(value) ~ "NA",
      T ~ as.character(value)
    )
  ) |>
  dplyr::filter(!is.na(name)) |>
  ggplot(aes(x = sample_id, y = name, fill = mutation_type)) +
  geom_tile()+
  scale_fill_manual(values = c("TRUE" = "black", "FALSE"= "grey", "NA"= "grey90"),
                    name = "Mutation", guide = guide_legend(ncol = 1)) +
  ylab("Mutation") +
  theme(axis.text.x = element_blank(), axis.title.x = element_blank(),
        axis.text.y = element_text(color = "black"), axis.ticks.length.x = unit(0, "mm"),
        legend.position = "right", plot.margin = margin(t = 0),
        panel.border = element_rect(fill = NA, color = "black", size = 0.5))

p5 <- full_cnvdf[ft, c("sample_id", cnvlevels)] |>
  mutate(sample_id = factor(sample_id, levels = sample_id)) |>
  pivot_longer(-sample_id) |>
  mutate(name = factor(name, levels = rev(cnvlevels)),
         value2 = case_when(is.na(value) ~ "NA",
                            T ~ value)) |>
  ggplot(aes(sample_id, name, fill = value2)) +
  geom_tile() +
  scale_fill_manual(values = config_list$cnv_color,
                    name = "CNV", guide = guide_legend(ncol = 1)) +
  scale_y_discrete(expand = expansion(mult = c(0, 0))) +
  ylab("CNV") +
  theme_few() +
  theme(axis.text.x = element_blank(), axis.title.x = element_blank(),
        axis.line.x = element_line(linewidth = 0.5, color = "black"),
        axis.text.y = element_text(color = "black"), axis.ticks.length.x = unit(0, "mm"),
        legend.position = "right", plot.margin = margin(t = 0),
        panel.border = element_rect(fill = NA, color = "black", size = 0.5))

pdf(glue("{out_dir}/figure2_heatmap.pdf"), width = 12, height = 10)
(p1 / p2 / p3 / p4 / p5) + plot_layout(ncol = 1, heights = c(0.1, 1.2, 0.8, 0.1*length(small_label), 1.3) * 0.05, guides = "collect") &
  theme(legend.position = "bottom")
dev.off()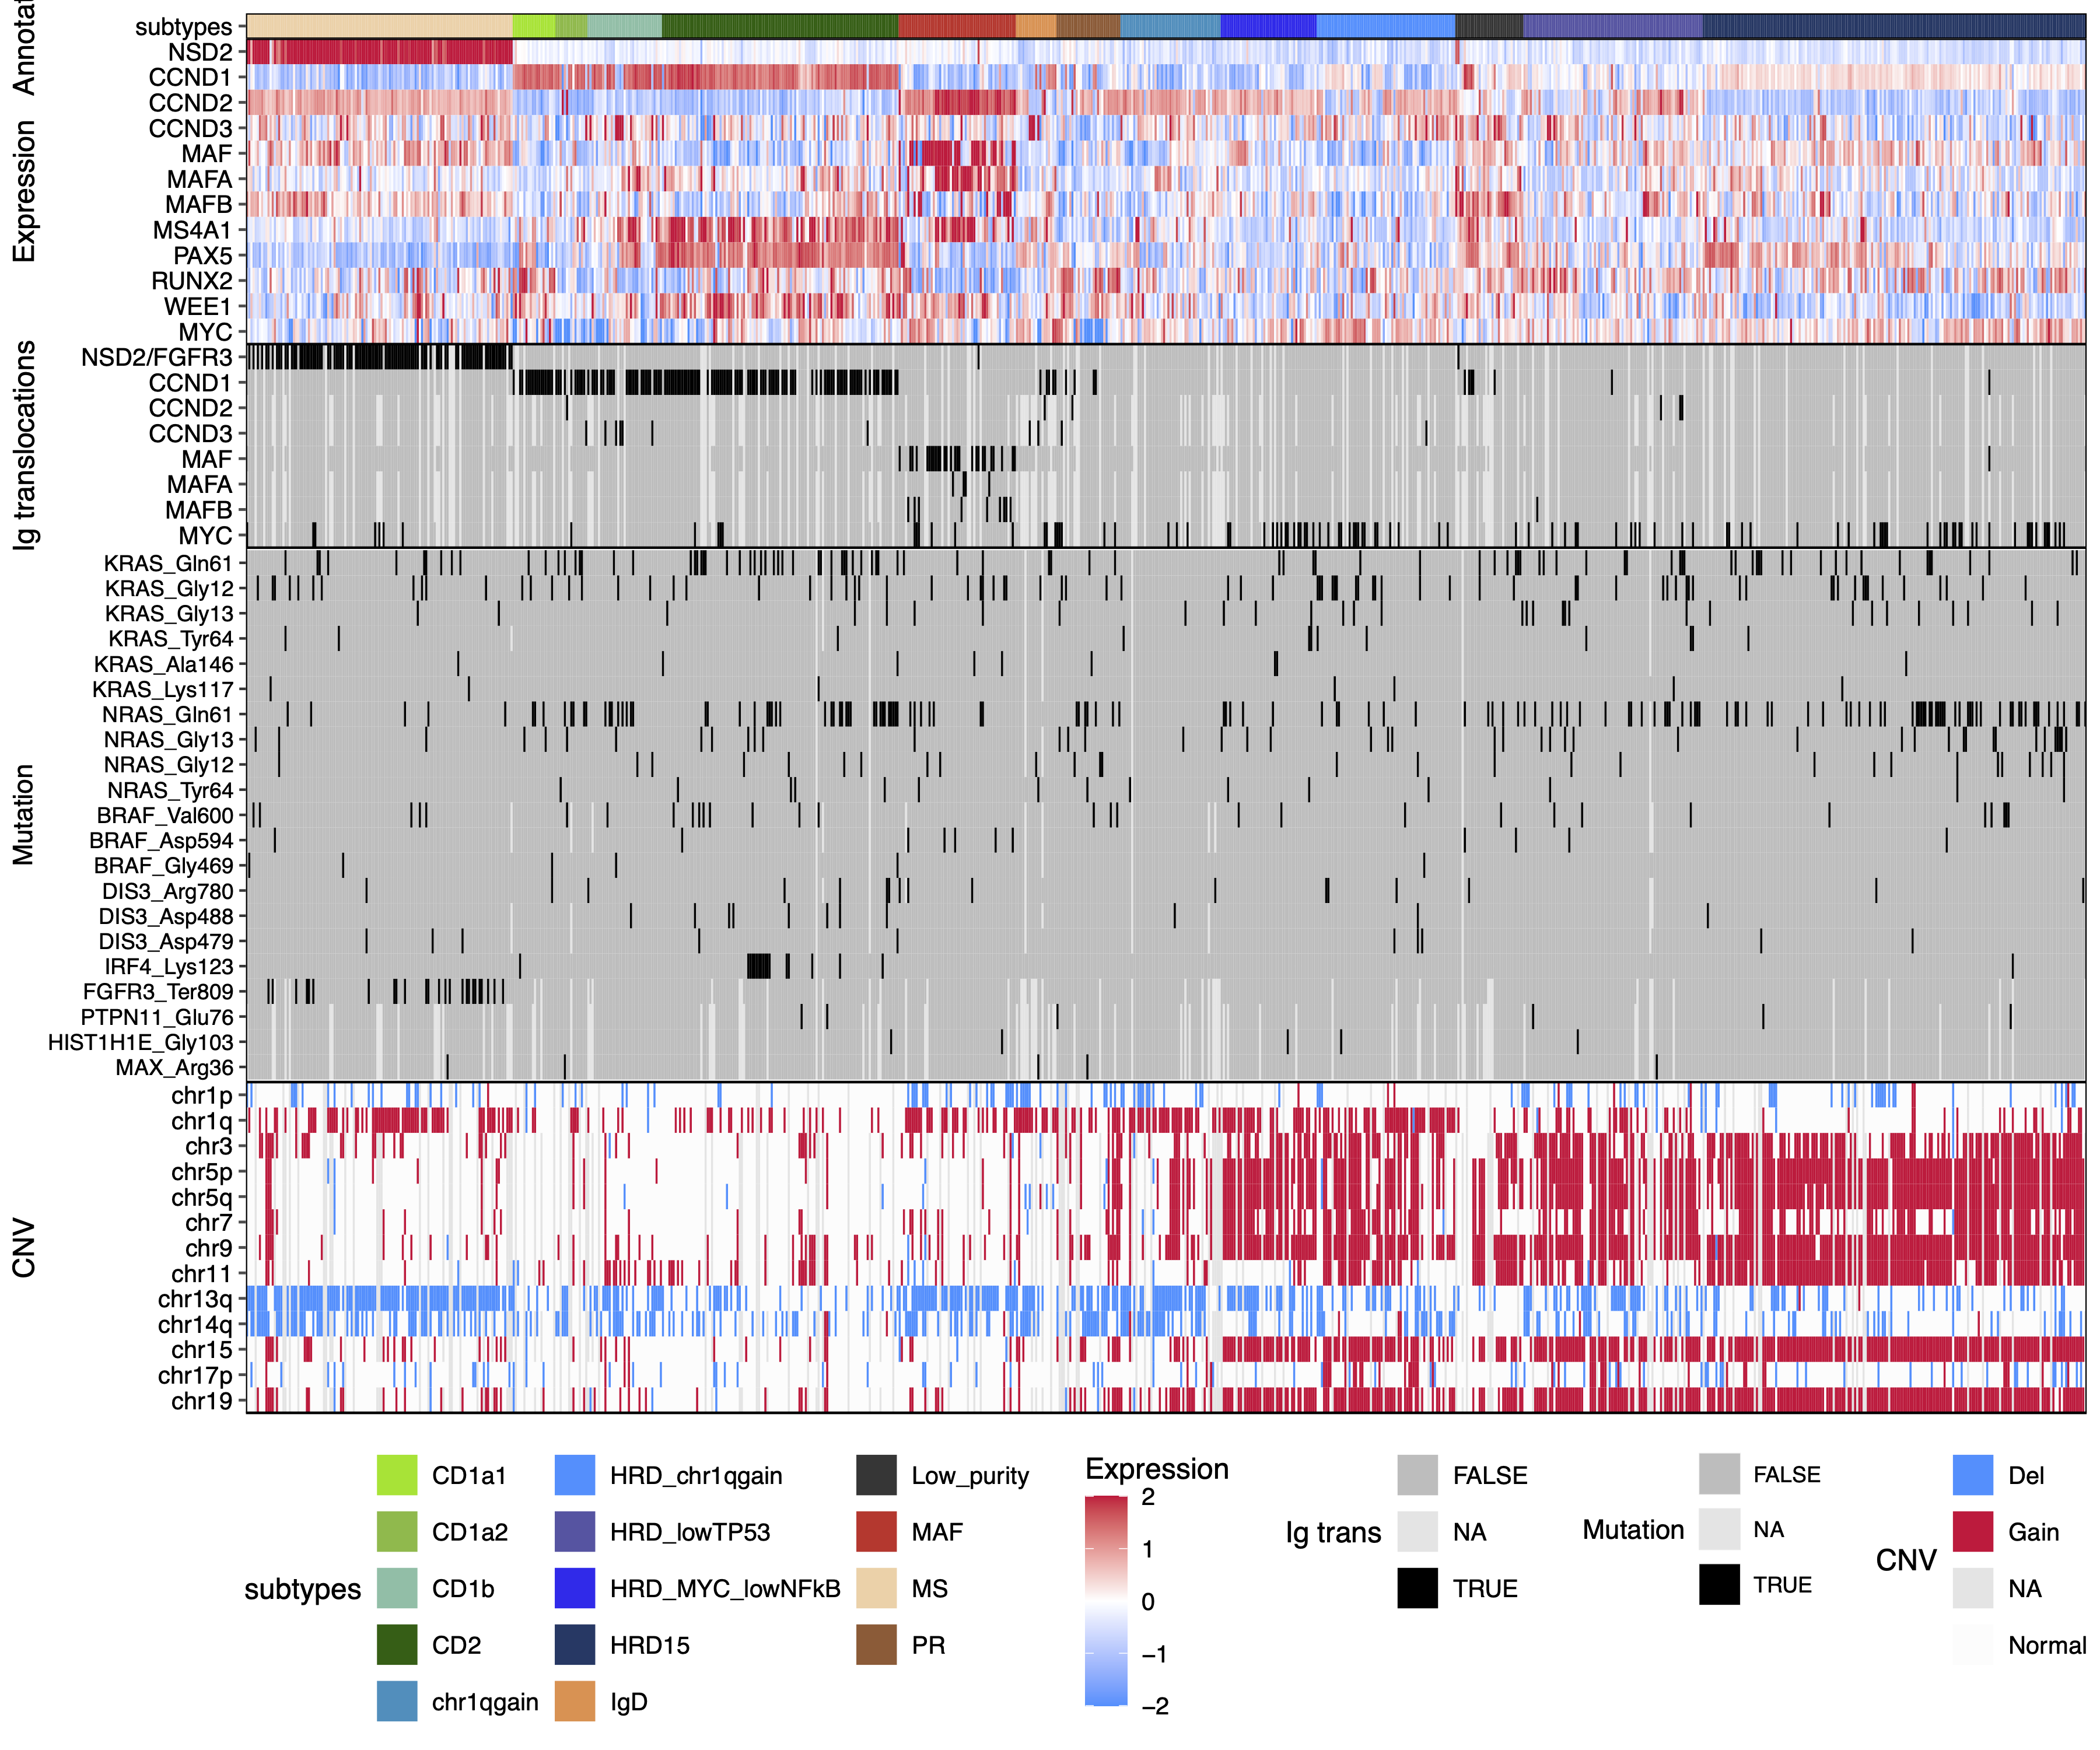
32.5.1 DNA events test
mutobj <- read_rds("/cluster/home/ztao_jh/projects/mm/analysis/meta/human/figures/heatmap/check_new_cluster_addsamples/check20250623/fig2/checkmutation/full_mutdf_anno.rds")
mutobj_list <- split(mutobj, f = mutobj$name)
cnvobj <- read_rds("/cluster/home/ztao_jh/projects/mm/analysis/meta/human/figures/heatmap/check_new_cluster_addsamples/check20250623/fig2/checkmutation/full_cnvdf_anno.rds")
cnvobj <- cnvobj %>% dplyr::select(- value2) %>% dplyr::rename(cnvtype = value)
cnvobj_list <- split(cnvobj, f = cnvobj$name)
mutobj_list_table <- lapply(mutobj_list, function(x){
tb <- x %>%
dplyr::filter(!is.na(value)) %>%
dplyr::filter(!is.na(subtypes)) %>%
dplyr::select(value, subtypes) %>%
table()
fisherobj <- tb %>%
fisher.test(simulate.p.value=TRUE)
groupn <- colSums(tb)
positiven <- tb["TRUE",]
edgepv <- rowSums(tb)
edgep <- edgepv["TRUE"]/(edgepv["TRUE"] + edgepv["FALSE"])
tbrat <- as.data.frame(t(tb)/groupn) %>%
dplyr::filter(value == "TRUE")
tbrat$multibinop <- lapply(names(groupn), function(i){
dpv <- dbinom(0:groupn[[i]], size = groupn[[i]], prob = edgep)
1-sum(dpv[1:(positiven[[i]]+1)])
}) %>% unlist()
tbrat$fisher_pvalue <- fisherobj$p.value
tbrat$positiven <- positiven
tbrat$groupn <- groupn
tbrat$edgep <- edgep
tbrat$type <- "subtypes"
colnames(tbrat)[1] <- "group"
tb <- x %>%
dplyr::filter(!is.na(value)) %>%
dplyr::filter(!is.na(ethnicity)) %>%
dplyr::select(value, ethnicity) %>%
table()
fisherobj <- tb %>%
fisher.test(simulate.p.value=TRUE)
groupn <- colSums(tb)
positiven <- tb["TRUE",]
edgepv <- rowSums(tb)
edgep <- edgepv["TRUE"]/(edgepv["TRUE"] + edgepv["FALSE"])
tbrat2 <- as.data.frame(t(tb)/groupn) %>%
dplyr::filter(value == "TRUE")
tbrat2$multibinop <- lapply(names(groupn), function(i){
dpv <- dbinom(0:groupn[[i]], size = groupn[[i]], prob = edgep)
1-sum(dpv[1:(positiven[[i]]+1)])
}) %>% unlist()
tbrat2$fisher_pvalue <- fisherobj$p.value
tbrat2$positiven <- positiven
tbrat2$edgep <- edgep
tbrat2$groupn <- groupn
tbrat2$type <- "ethnicity"
colnames(tbrat2)[1] <- "group"
rbind(tbrat, tbrat2)
})|>
list_rbind(names_to = "label")
mutobj_list_table$mutation_type <- "mutation"
mutobj2 <- read_rds("/cluster/home/ztao_jh/projects/mm/analysis/meta/human/figures/heatmap/check_new_cluster_addsamples/check20250623/fig2/checkmutation/full_mutdf_anno.rds")
mutobj2 <- mutobj2 |>
dplyr::mutate(gene = str_extract(name, pattern = ".+?(?=_)")) |>
group_by(sample_id, gene, subtypes, ethnicity) |>
summarise(value = case_when(
all(is.na(value)) ~ NA,
any(na.omit(value)) ~ T,
all(!na.omit(value)) ~ F
)) |>
ungroup()
colnames(mutobj2)[2] <- "name"
mutobj_list2 <- split(mutobj2, f = mutobj2$name)
mutobj_list_table2 <- lapply(mutobj_list2, function(x){
tb <- x %>%
dplyr::filter(!is.na(value)) %>%
dplyr::filter(!is.na(subtypes)) %>%
dplyr::select(value, subtypes) %>%
table()
fisherobj <- tb %>%
fisher.test(simulate.p.value=TRUE)
groupn <- colSums(tb)
positiven <- tb["TRUE",]
edgepv <- rowSums(tb)
edgep <- edgepv["TRUE"]/(edgepv["TRUE"] + edgepv["FALSE"])
tbrat <- as.data.frame(t(tb)/groupn) %>%
dplyr::filter(value == "TRUE")
tbrat$multibinop <- lapply(names(groupn), function(i){
dpv <- dbinom(0:groupn[[i]], size = groupn[[i]], prob = edgep)
1-sum(dpv[1:(positiven[[i]]+1)])
}) %>% unlist()
tbrat$fisher_pvalue <- fisherobj$p.value
tbrat$positiven <- positiven
tbrat$groupn <- groupn
tbrat$edgep <- edgep
tbrat$type <- "subtypes"
colnames(tbrat)[1] <- "group"
tb <- x %>%
dplyr::filter(!is.na(value)) %>%
dplyr::filter(!is.na(ethnicity)) %>%
dplyr::select(value, ethnicity) %>%
table()
fisherobj <- tb %>%
fisher.test(simulate.p.value=TRUE)
groupn <- colSums(tb)
positiven <- tb["TRUE",]
edgepv <- rowSums(tb)
edgep <- edgepv["TRUE"]/(edgepv["TRUE"] + edgepv["FALSE"])
tbrat2 <- as.data.frame(t(tb)/groupn) %>%
dplyr::filter(value == "TRUE")
tbrat2$multibinop <- lapply(names(groupn), function(i){
dpv <- dbinom(0:groupn[[i]], size = groupn[[i]], prob = edgep)
1-sum(dpv[1:(positiven[[i]]+1)])
}) %>% unlist()
tbrat2$fisher_pvalue <- fisherobj$p.value
tbrat2$positiven <- positiven
tbrat2$edgep <- edgep
tbrat2$groupn <- groupn
tbrat2$type <- "ethnicity"
colnames(tbrat2)[1] <- "group"
rbind(tbrat, tbrat2)
})|>
list_rbind(names_to = "label")
mutobj_list_table2$mutation_type <- "mutation"
cnvobj_list_table_Gain <- lapply(cnvobj_list, function(x){
x <- x %>% mutate(
value = case_when(
cnvtype == "Gain" ~ TRUE,
cnvtype %in% c("Normal", "Del") ~ FALSE,
)
)
tb <- x %>%
dplyr::filter(!is.na(value)) %>%
dplyr::filter(!is.na(subtypes)) %>%
dplyr::select(value, subtypes) %>%
table()
fisherobj <- tb %>%
fisher.test(simulate.p.value=TRUE)
groupn <- colSums(tb)
positiven <- tb["TRUE",]
edgepv <- rowSums(tb)
edgep <- edgepv["TRUE"]/(edgepv["TRUE"] + edgepv["FALSE"])
tbrat <- as.data.frame(t(tb)/groupn) %>%
dplyr::filter(value == "TRUE")
tbrat$multibinop <- lapply(names(groupn), function(i){
dpv <- dbinom(0:groupn[[i]], size = groupn[[i]], prob = edgep)
1-sum(dpv[1:(positiven[[i]]+1)])
}) %>% unlist()
tbrat$fisher_pvalue <- fisherobj$p.value
tbrat$positiven <- positiven
tbrat$edgep <- edgep
tbrat$groupn <- groupn
tbrat$type <- "subtypes"
colnames(tbrat)[1] <- "group"
tb <- x %>%
dplyr::filter(!is.na(value)) %>%
dplyr::filter(!is.na(ethnicity)) %>%
dplyr::select(value, ethnicity) %>%
table()
fisherobj <- tb %>%
fisher.test(simulate.p.value=TRUE)
groupn <- colSums(tb)
positiven <- tb["TRUE",]
edgepv <- rowSums(tb)
edgep <- edgepv["TRUE"]/(edgepv["TRUE"] + edgepv["FALSE"])
tbrat2 <- as.data.frame(t(tb)/groupn) %>%
dplyr::filter(value == "TRUE")
tbrat2$multibinop <- lapply(names(groupn), function(i){
dpv <- dbinom(0:groupn[[i]], size = groupn[[i]], prob = edgep)
1-sum(dpv[1:(positiven[[i]]+1)])
}) %>% unlist()
tbrat2$fisher_pvalue <- fisherobj$p.value
tbrat2$positiven <- positiven
tbrat2$edgep <- edgep
tbrat2$groupn <- groupn
tbrat2$type <- "ethnicity"
colnames(tbrat2)[1] <- "group"
rbind(tbrat, tbrat2)
})|>
list_rbind(names_to = "label")
cnvobj_list_table_Gain$mutation_type <- "Gain"
cnvobj_list_table_Del <- lapply(cnvobj_list, function(x){
x <- x %>% mutate(
value = case_when(
cnvtype == "Del" ~ TRUE,
cnvtype %in% c("Normal", "Del") ~ FALSE,
)
)
tb <- x %>%
dplyr::filter(!is.na(value)) %>%
dplyr::filter(!is.na(subtypes)) %>%
dplyr::select(value, subtypes) %>%
table()
fisherobj <- tb %>%
fisher.test(simulate.p.value=TRUE)
groupn <- colSums(tb)
positiven <- tb["TRUE",]
edgepv <- rowSums(tb)
edgep <- edgepv["TRUE"]/(edgepv["TRUE"] + edgepv["FALSE"])
tbrat <- as.data.frame(t(tb)/groupn) %>%
dplyr::filter(value == "TRUE")
tbrat$multibinop <- lapply(names(groupn), function(i){
dpv <- dbinom(0:groupn[[i]], size = groupn[[i]], prob = edgep)
1-sum(dpv[1:(positiven[[i]]+1)])
}) %>% unlist()
tbrat$fisher_pvalue <- fisherobj$p.value
tbrat$positiven <- positiven
tbrat$edgep <- edgep
tbrat$groupn <- groupn
tbrat$type <- "subtypes"
colnames(tbrat)[1] <- "group"
tb <- x %>%
dplyr::filter(!is.na(value)) %>%
dplyr::filter(!is.na(ethnicity)) %>%
dplyr::select(value, ethnicity) %>%
table()
fisherobj <- tb %>%
fisher.test(simulate.p.value=TRUE)
groupn <- colSums(tb)
positiven <- tb["TRUE",]
edgepv <- rowSums(tb)
edgep <- edgepv["TRUE"]/(edgepv["TRUE"] + edgepv["FALSE"])
tbrat2 <- as.data.frame(t(tb)/groupn) %>%
dplyr::filter(value == "TRUE")
tbrat2$multibinop <- lapply(names(groupn), function(i){
dpv <- dbinom(0:groupn[[i]], size = groupn[[i]], prob = edgep)
1-sum(dpv[1:(positiven[[i]]+1)])
}) %>% unlist()
tbrat2$fisher_pvalue <- fisherobj$p.value
tbrat2$positiven <- positiven
tbrat2$edgep <- edgep
tbrat2$groupn <- groupn
tbrat2$type <- "ethnicity"
colnames(tbrat2)[1] <- "group"
rbind(tbrat, tbrat2)
})|>
list_rbind(names_to = "label")
cnvobj_list_table_Del$mutation_type <- "Del"
subtypesorder <- subdf[ft, c("sample_id", "subtypes")] |>
mutate(sample_id = factor(sample_id, levels = sample_id)) |>
pivot_longer(-sample_id, names_to = "name", values_to = "subtypes") |>
pull(subtypes) |> unique()
subtypesorder <- c(subtypesorder, "Caucasian", "Asian", "African")
fulldf <- rbind(mutobj_list_table,
mutobj_list_table2,
cnvobj_list_table_Gain,
cnvobj_list_table_Del)
small_label_fix <- c(
"KRAS_Gln61", "KRAS_Gly12", "KRAS_Gly13", "KRAS_Tyr64", "KRAS_Ala146", "KRAS_Lys117", "KRAS",
"NRAS_Gln61", "NRAS_Gly13", "NRAS_Gly12", "NRAS_Tyr64", "NRAS",
"BRAF_Val600", "BRAF_Asp594", "BRAF_Gly469", "BRAF",
"DIS3_Arg780", "DIS3_Asp488", "DIS3_Asp479", "DIS3",
"IRF4_Lys123",
"FGFR3_Ter809")
fulldf <- fulldf |>
dplyr::filter(group != "other") |>
mutate(mutation_type = factor(mutation_type, levels = c("mutation", "Gain", "Del")),
group = factor(group, levels = subtypesorder),
label = factor(label, levels = c(small_label_fix, cnvlevels) |> rev()),
type = factor(type, levels = c("subtypes", "ethnicity"))) |>
na.omit()
# ==============================================================================
# plot
out_dir <- dir_create("mutations_heatmap")
draw_main <- function(fulldf, color_h = "#DC143C"){
ggplot(mapping = aes(x = group, y = label,
fill = Freq, color = mutation_type)) +
geom_tile(data = fulldf, color = "grey") +
scale_fill_gradient2(high = color_h,
name = "Rate in groups",
guide = guide_colorbar(direction = "vertical")) +
geom_text(data = fulldf |>
dplyr::filter(multibinop < 0.05 & fisher_pvalue < 0.05) |>
mutate(star = case_when(
multibinop < 0.01 ~ "**",
multibinop < 0.05 ~ "*"
)),
mapping = aes(label = star),
color = "black", size = 5, nudge_y = - 0.25) +
geom_text(data = fulldf |>
dplyr::filter(multibinop < 0.1 & multibinop > 0.05 & fisher_pvalue < 0.05 & positiven > 2) |>
mutate(multibinop = signif(multibinop, digits = 2)),
mapping = aes(label = multibinop),
color = "black", size = 3) +
facet_grid(mutation_type ~ type, scales = "free", space = "free")+
scale_x_discrete(expand = expansion(mult = c(0, 0))) +
scale_y_discrete(expand = expansion(mult = c(0, 0))) +
theme_few() +
theme(axis.text.x = element_text(angle = 90, hjust = 1, vjust = 0.5),
axis.title.x = element_blank(),
axis.line.x = element_line(linewidth = 0.5, color = "black"),
axis.title.y = element_blank(),
axis.text.y = element_text(color = "black"),
axis.ticks.length.x = unit(0, "mm"),
legend.position = "right",
plot.margin = margin(t = 0, r = 0),
strip.background = element_blank(),
strip.text = element_blank(),
panel.border = element_rect(fill = NA, color = "black", size = 0.5),
panel.spacing.x = unit(0, "mm"),
panel.spacing.y = unit(0, "mm"))
}
main_p1 <- draw_main(fulldf |> dplyr::filter(mutation_type == "mutation"), color_h = "#7BBB42") +
theme(axis.text.x = element_blank(),
axis.ticks.x = element_blank(),
axis.ticks.length.x = unit(0, "mm"),
axis.title.x = element_blank())
main_p2 <- draw_main(fulldf |> dplyr::filter(mutation_type == "Gain"), color_h = "#DC143C")+
theme(axis.text.x = element_blank(),
axis.ticks.x = element_blank(),
axis.ticks.length.x = unit(0, "mm"),
axis.title.x = element_blank())
main_p3 <- draw_main(fulldf |> dplyr::filter(mutation_type == "Del"), color_h = "#1E90FF")
top_p <- fulldf |> dplyr::select(group, type) |>
dplyr::distinct() |>
ggplot(mapping = aes(x = group, y = 1, color = group, shape = type)) +
geom_tile(fill = NA, color = NA) +
geom_point(size = 4)+
facet_grid(. ~ type, scales = "free", space = "free")+
scale_x_discrete(expand = expansion(mult = c(0, 0))) +
scale_color_manual(values = c(col$subtypes, col$ethnicity),
guide = guide_legend(ncol = 3),
name = "Group") +
scale_shape_manual(values = c(subtypes = 16, ethnicity = 17),
guide = guide_legend(ncol = 1),
name = "Types") +
theme_few() +
theme(plot.margin = margin(b = 0),
axis.text.x = element_blank(),
axis.title.x = element_blank(),
axis.ticks.x = element_blank(),
axis.ticks.length.x = unit(0, "mm"),
axis.title.y = element_blank(),
axis.text.y = element_blank(),
axis.ticks.y = element_blank(),
panel.spacing.x = unit(0, "mm"))
rightp <- fulldf |>
dplyr::filter(type == "subtypes") |>
dplyr::select(label, edgep, mutation_type, fisher_pvalue) |>
dplyr::distinct()|>
ggplot(mapping = aes(x = edgep, y = label, fill = -log10(fisher_pvalue))) +
geom_tile(fill = NA, color = NA) +
geom_bar(stat = "identity", position = "dodge") +
facet_grid(mutation_type ~ 1, scales = "free", space = "free")+
scale_y_discrete(expand = expansion(mult = c(0, 0))) +
scale_x_continuous(expand = expansion(mult = c(0, 0)),
n.breaks = 3) +
scale_fill_gradient2(high = "#035e03",
name = "-log10(Fisher pvalue)",
guide = guide_colorbar(direction = "vertical")) +
theme_few() +
theme(plot.margin = margin(l = 0),
# axis.title.x = element_blank(),
axis.title.y = element_blank(),
axis.text.y = element_blank(),
axis.ticks.y = element_blank(),
axis.ticks.length.y = unit(0, "mm"),
strip.background.x = element_blank(),
strip.text.x = element_blank(),
panel.spacing.x = unit(0, "mm"),
panel.spacing.y = unit(0, "mm"))
pempth <- ggplot() +
theme_few() +
theme(plot.margin = margin(l = 0),
axis.text.x = element_blank(),
axis.title.x = element_blank(),
axis.ticks.x = element_blank(),
axis.ticks.length.x = unit(0, "mm"),
axis.title.y = element_blank(),
axis.text.y = element_blank(),
axis.ticks.y = element_blank(),
axis.ticks.length.y = unit(0, "mm"),
strip.background = element_blank(),
strip.text = element_blank(),
panel.border = element_blank())
pdf(glue("{out_dir}/fig2_heatmap_dna_test.pdf"), width = 8, height = 11)
top_p + pempth + (main_p1+ main_p2+ main_p3+ plot_layout(ncol = 1,
heights = c(length(small_label_fix),
length(cnvlevels),
length(cnvlevels)))) +
rightp + plot_layout(ncol = 2,
heights = c(2, length(subtypesorder) +
length(small_label_fix) +
length(cnvlevels)*2),
widths = c(17, 1.5),
guides = "collect") &
theme(legend.position = "bottom")
dev.off()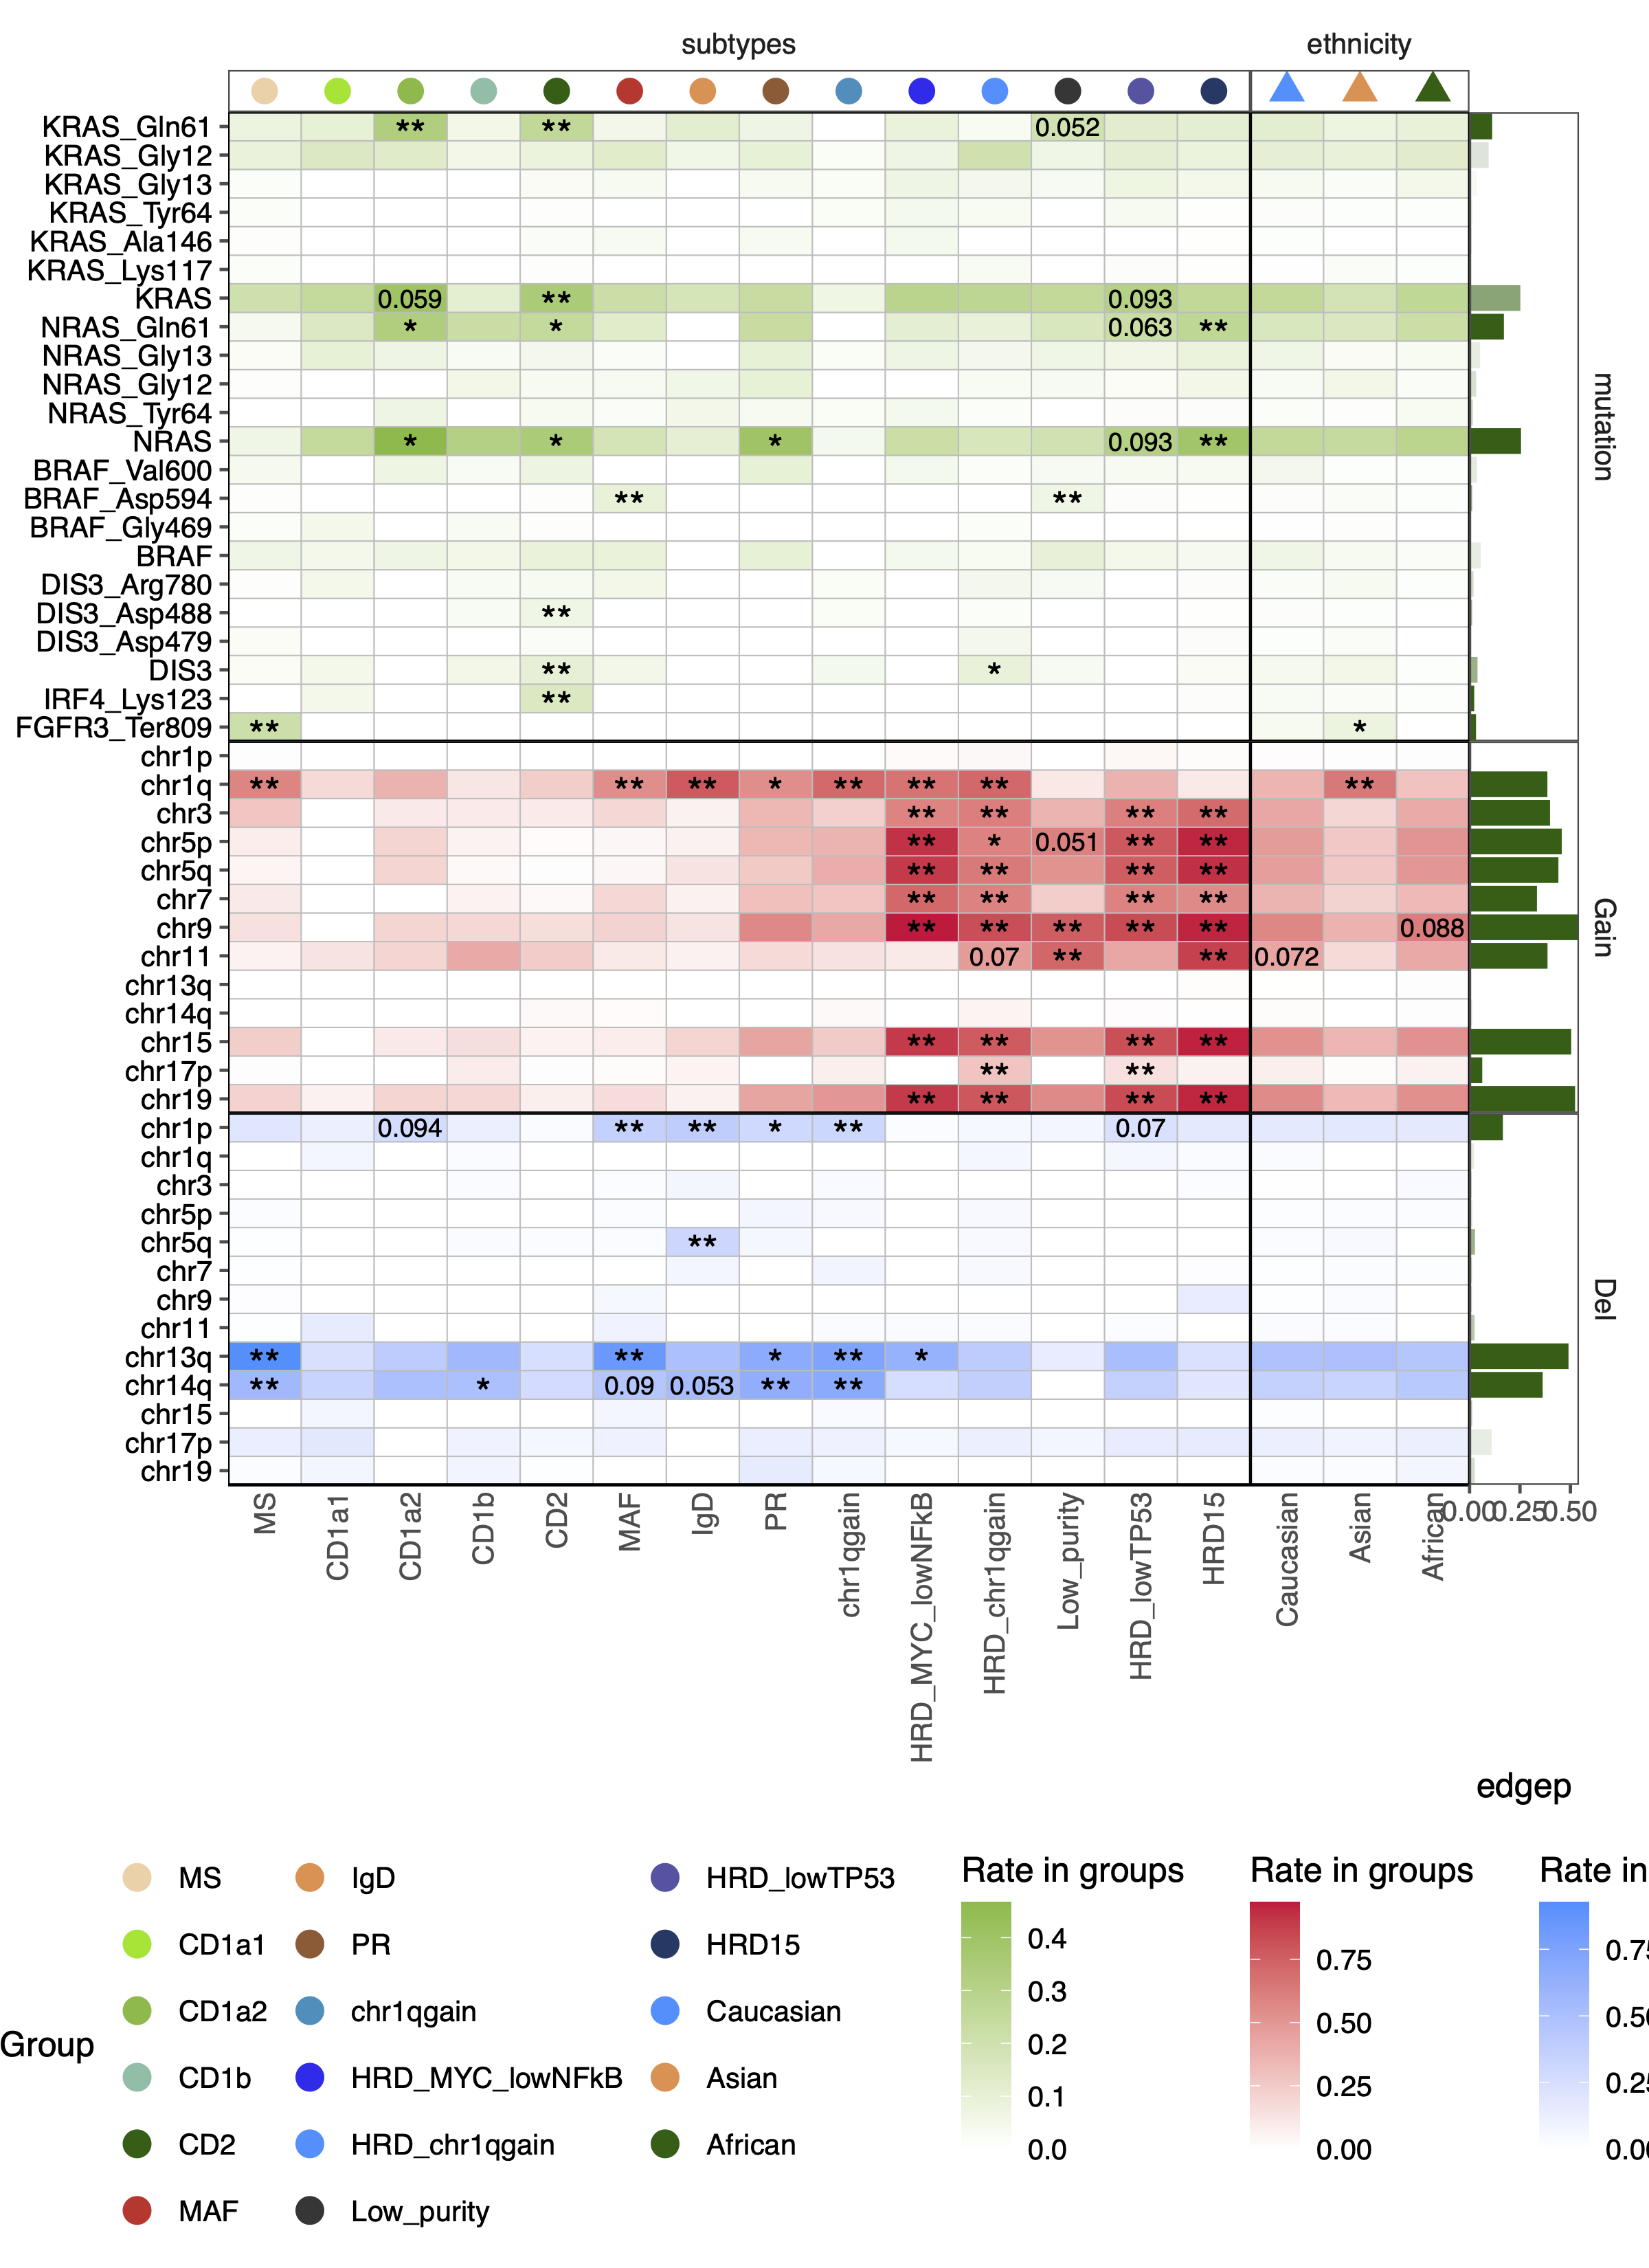 ### DNA events test
small_label <- read_rds("/cluster/home/ztao_jh/projects/mm/analysis/meta/human/figures/heatmap/check_new_cluster_addsamples/check20250623/commpass_wd_mutation_clean_small_label.rds")
commpass_maf <- "/cluster/home/yjliu_jh/projects/mm/output/41588_2024_1853_MOESM5_ESM_hg38.rds" |>
  read_rds()
commpass_maf_sub <- commpass_maf |> dplyr::select(
  sample_id = sample, GENE,
  chr = Chromosome, pos = Start_Position, REF, ALT,
  TUMOR_REF_AD, TUMOR_ALT_AD, TUMOR_ALT_FREQ, HGVS_P)|>
  dplyr::filter(HGVS_P != ".") |>
  mutate(aa.pos = str_extract(HGVS_P, pattern = "(?<=p\\.)[A-Za-z]+\\d+"),
         small_label = paste0(GENE, "_", aa.pos),
         dataype = "WGS")|>
  dplyr::filter(small_label %in% {{small_label}})


all_mutation_df_fix_anno <- read_rds("/cluster/home/ztao_jh/projects/mm/analysis/meta/human/figures/heatmap/check_new_cluster_addsamples/check20250623/fig2/checkmutation/samtools_subsamples_mutation_df.rds") |>
  dplyr::filter(mutation_label == "usemutation") |>
  mutate(
    max_alt_count = max(c(a, t, c, g)),
    max_alt_vaf = max_alt_count/(a + t + c + g + match),
    alt = c("A", "T", "C", "G")[which.max(c(a, t, c, g))]
  ) |>
  ungroup()|>
  mutate(small_label = paste0(gene, "_", aa.pos)) |>
  dplyr::filter(small_label %in% {{small_label}})

all_mutation_df_fix_anno_sub <- all_mutation_df_fix_anno |>
  dplyr::select(small_label, sample_id, dataype, max_alt_vaf)
commpass_maf_sub_sub <- commpass_maf_sub |>
  dplyr::select(small_label, sample_id, dataype, max_alt_vaf = TUMOR_ALT_FREQ)
all_mutation <- rbind(all_mutation_df_fix_anno_sub, commpass_maf_sub_sub)
all_mutation <- all_mutation |> dplyr::filter(sample_id %in% subdf$sample_id[ft])

small_label_all <- all_mutation$small_label |> unique()
summary_all_mutation <- all_mutation |>
  dplyr::filter(small_label %in% small_label_all) |>
  mutate(mutation_type = case_when(
    str_detect(small_label, pattern = "NRAS|KRAS") ~ "NRAS/KRAS",
    str_detect(small_label, pattern = "IRF4_Lys123") ~ "IRF4_Lys123",
    str_detect(small_label, pattern = "FGFR3") ~ "FGFR3",
    str_detect(small_label, pattern = "DIS3") ~ "DIS3",
    str_detect(small_label, pattern = "BRAF") ~ "BRAF",
    T ~ "others"
  )) |>
  group_by(sample_id, dataype, small_label, mutation_type) |>
  summarise(
    max_alt_vaf = max(max_alt_vaf)
  ) |>
  ungroup()

table(summary_all_mutation$mutation_type, summary_all_mutation$small_label)

pdf(glue("figure2_vaf_point.pdf"))
print(summary_all_mutation |>
        pivot_wider(id_cols = c(sample_id, small_label, mutation_type),
                    names_from = dataype, values_from = max_alt_vaf) |>
        na.omit() |>
        arrange(desc(mutation_type)) |>
        ggplot(aes(x = RNA, y = WGS, color = mutation_type)) +
        geom_point() +
        geom_smooth(method = "lm", se = FALSE) +
        scale_color_manual(values = c("NRAS/KRAS" = "#D1352B", "IRF4_Lys123" = "#035e03",
                                      "FGFR3" = "#EE934E", "DIS3" = "#1E90FF","BRAF" = "#5653a5",
                                      "others" = "grey")) +
        theme_few() +
        theme(
          legend.position = "bottom"
        )
)
dev.off()


mutation_gene_color <- c(
  "#D1352B", "#EE934E", "#9B5B33","#F5D2A8",
  "#129a71", "#89e409", "#035e03", "#7BBB42", "#7DBFA7"
  )
names(mutation_gene_color) <- c("KRAS", "NRAS", "IRF4", "DIS3",
                                "BRAF", "FGFR3",
                                "PTPN11", "MAX", "HIST1H1E")
pdf(glue("all_point_supp.pdf"))
print(summary_all_mutation |>
        pivot_wider(id_cols = c(sample_id, small_label, mutation_type),
                    names_from = dataype, values_from = max_alt_vaf) |>
        na.omit() |>
        mutate(Gene = str_extract(small_label, pattern = ".+?(?=_)"),
               Gene = factor(Gene, levels = c("KRAS", "NRAS", "IRF4", "DIS3",
                                              "BRAF", "FGFR3",
                                              "PTPN11", "MAX", "HIST1H1E"))) |>
        ggplot(aes(x = RNA, y = WGS, color = Gene)) +
        geom_point() +
        geom_smooth(method = "lm", se = FALSE) +
        scale_color_manual(values = mutation_gene_color) +
        theme_few() +
        theme(
          legend.position = "bottom"
        ) +
        facet_wrap(~ Gene)
)
dev.off()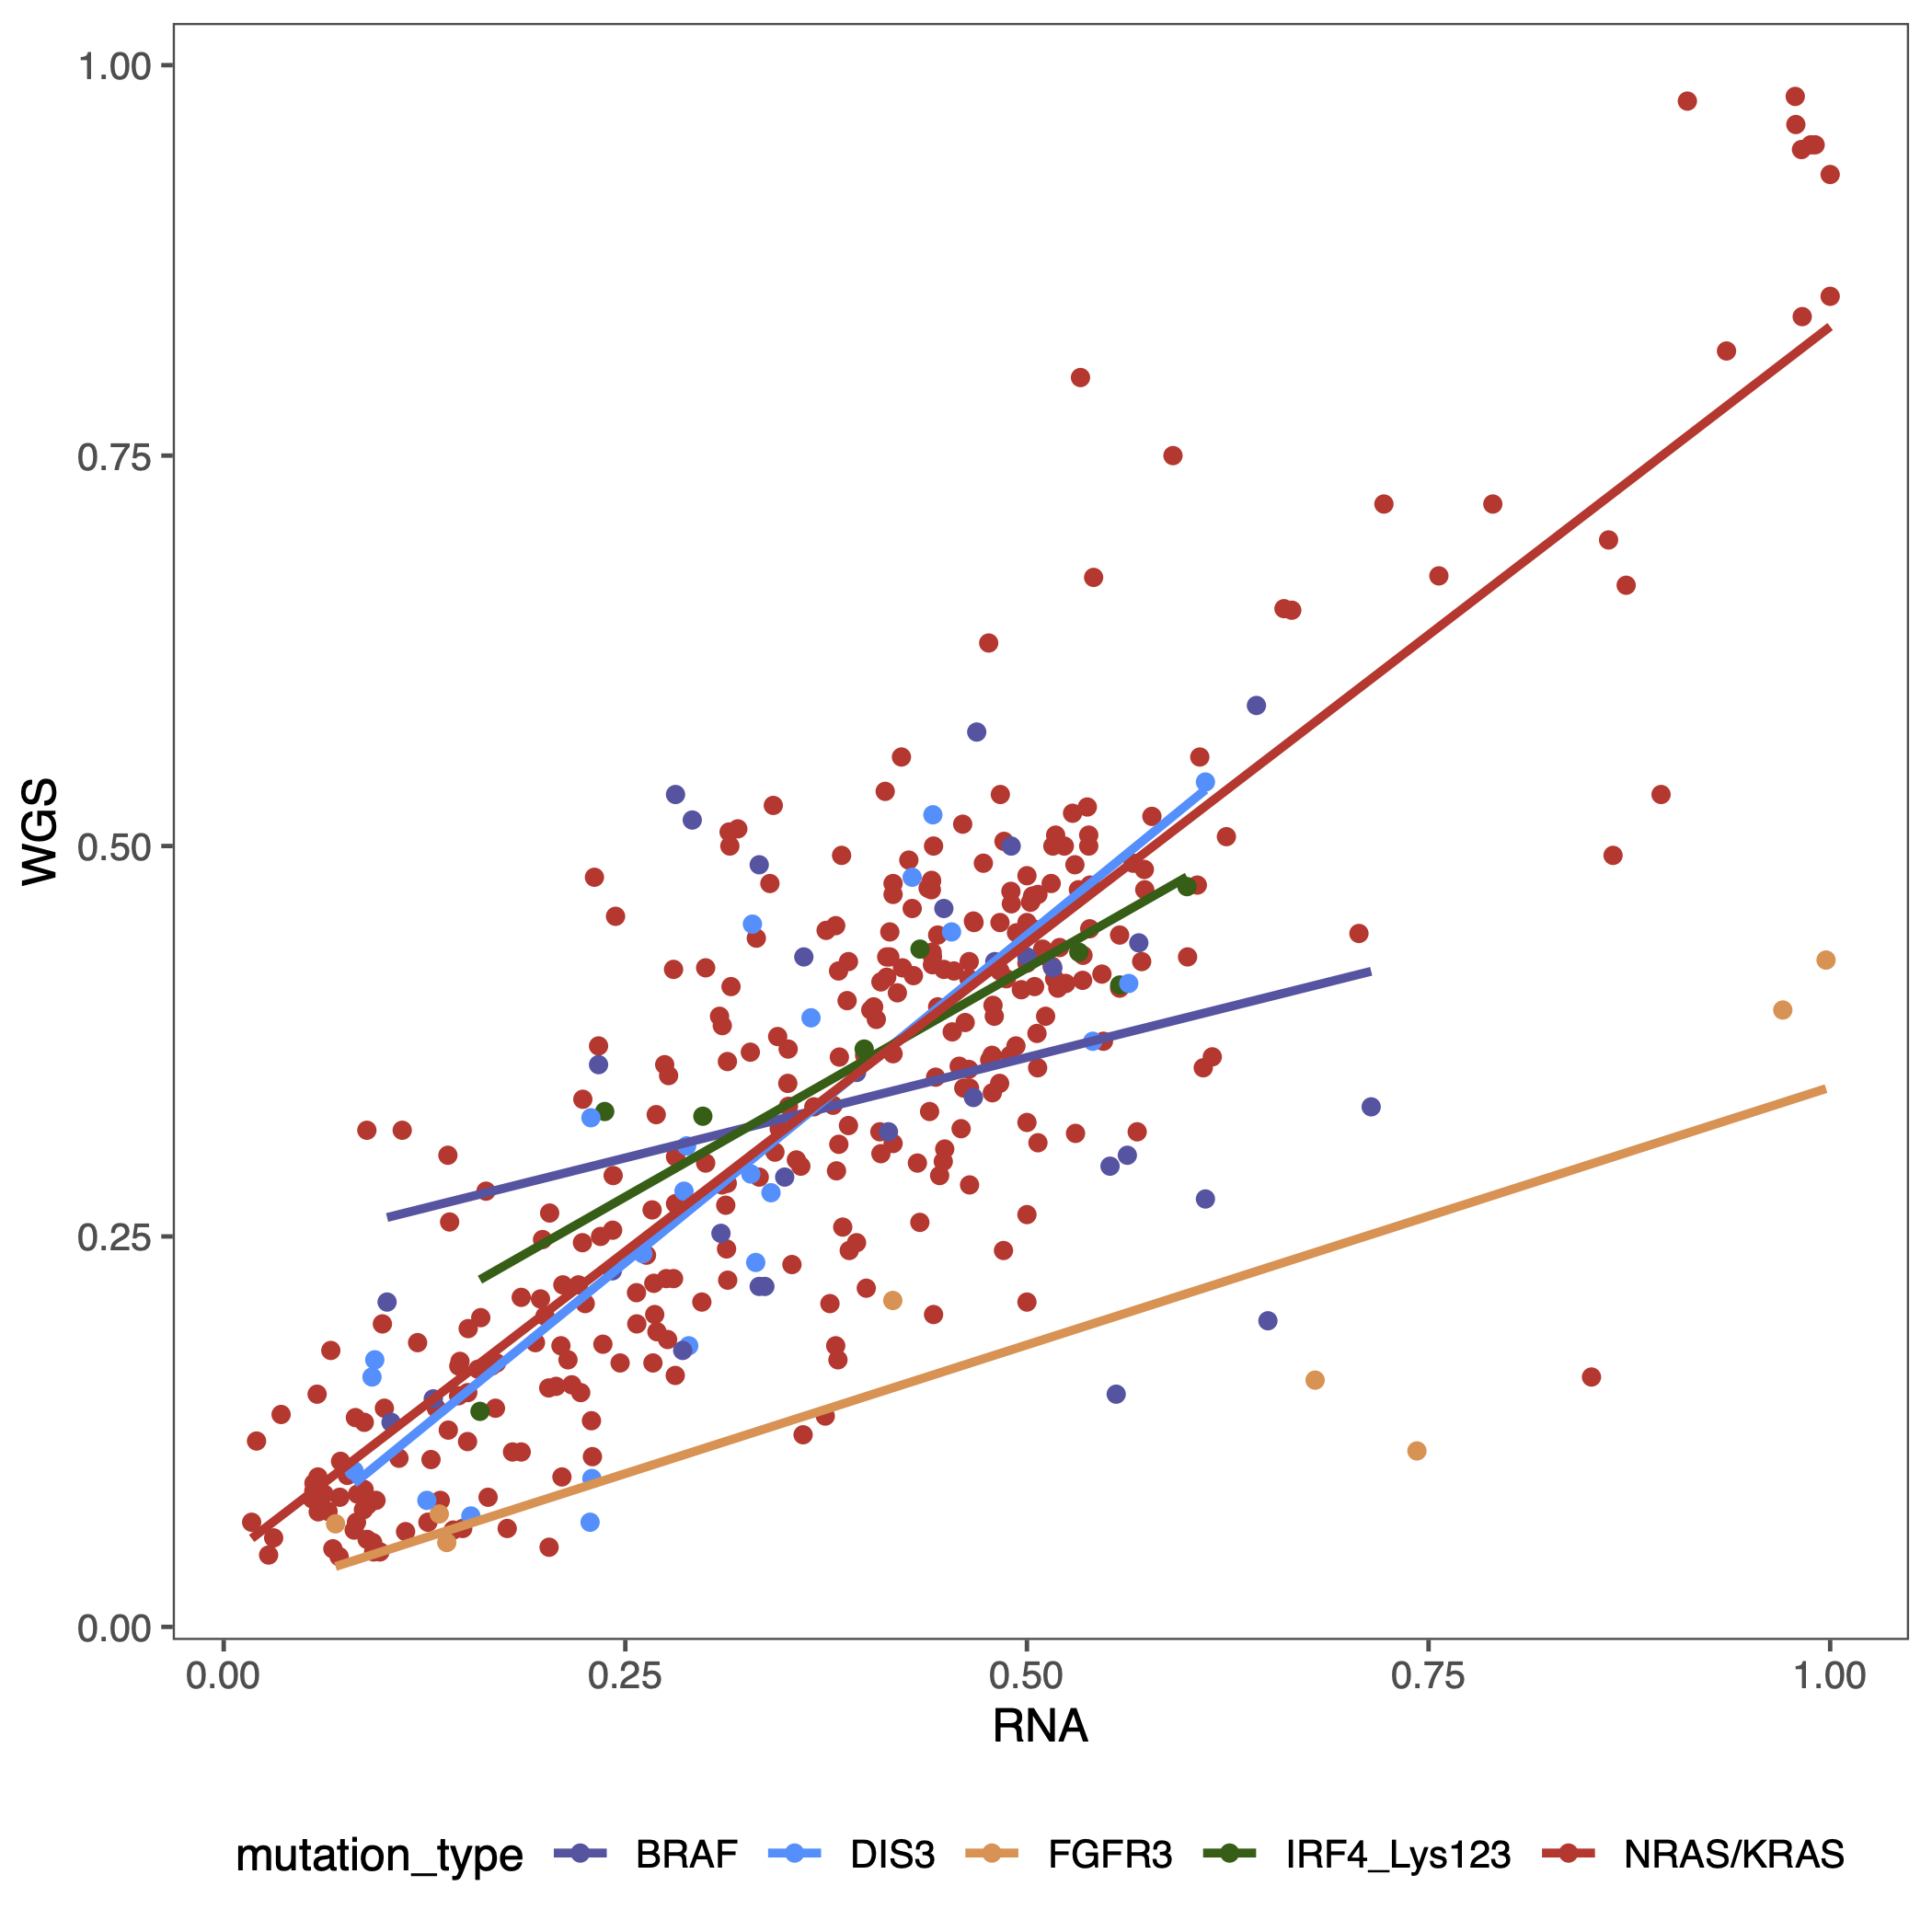
mycolor <- c("RNA" = "#EE934E", "WGS" = "#035e03")
pdf(glue("figure2_vaf_box.pdf"), height = 4)
print(
  ggplot(summary_all_mutation |>
           mutate(dataype = factor(dataype, levels = unique(dataype)),
                  mutation_type = factor(mutation_type, levels = c("NRAS/KRAS", "IRF4_Lys123", "DIS3", "BRAF", "FGFR3", "others"))),
         aes(x=dataype,
             y=max_alt_vaf,
             fill=dataype,
             color=dataype)) +
    scale_color_manual(values=rev(mycolor)) +
    scale_fill_manual(values=rev(mycolor)) +
    geom_half_violin(position = position_nudge(x = 0.1, y = 0),
                     side = 'R', adjust = 1.2, trim = F, color = NA, alpha = 0.8) +
    geom_point(aes(x = as.numeric(dataype) - 0.1,
                   y = max_alt_vaf,
                   color = dataype),
               position = position_jitter(width = 0.03),size = 1, shape = 20) +
    # geom_boxplot(outlier.shape = NA, width = 0.1, alpha = 0.7) +
    geom_boxplot(width = 0.1, alpha = 0.7, outlier.size = 1, outlier.shape = 20) +
    geom_hline(yintercept = 0.5, color = "#D1352B") +
    geom_hline(yintercept = c(0.333333, 0.666666), linetype = "dashed", color = "grey") +
    theme_few() +
    theme(
      legend.position = "bottom",
      panel.spacing.x = unit(0, "mm")
    ) +
    facet_grid(.~mutation_type, space = "free_x")
)
dev.off()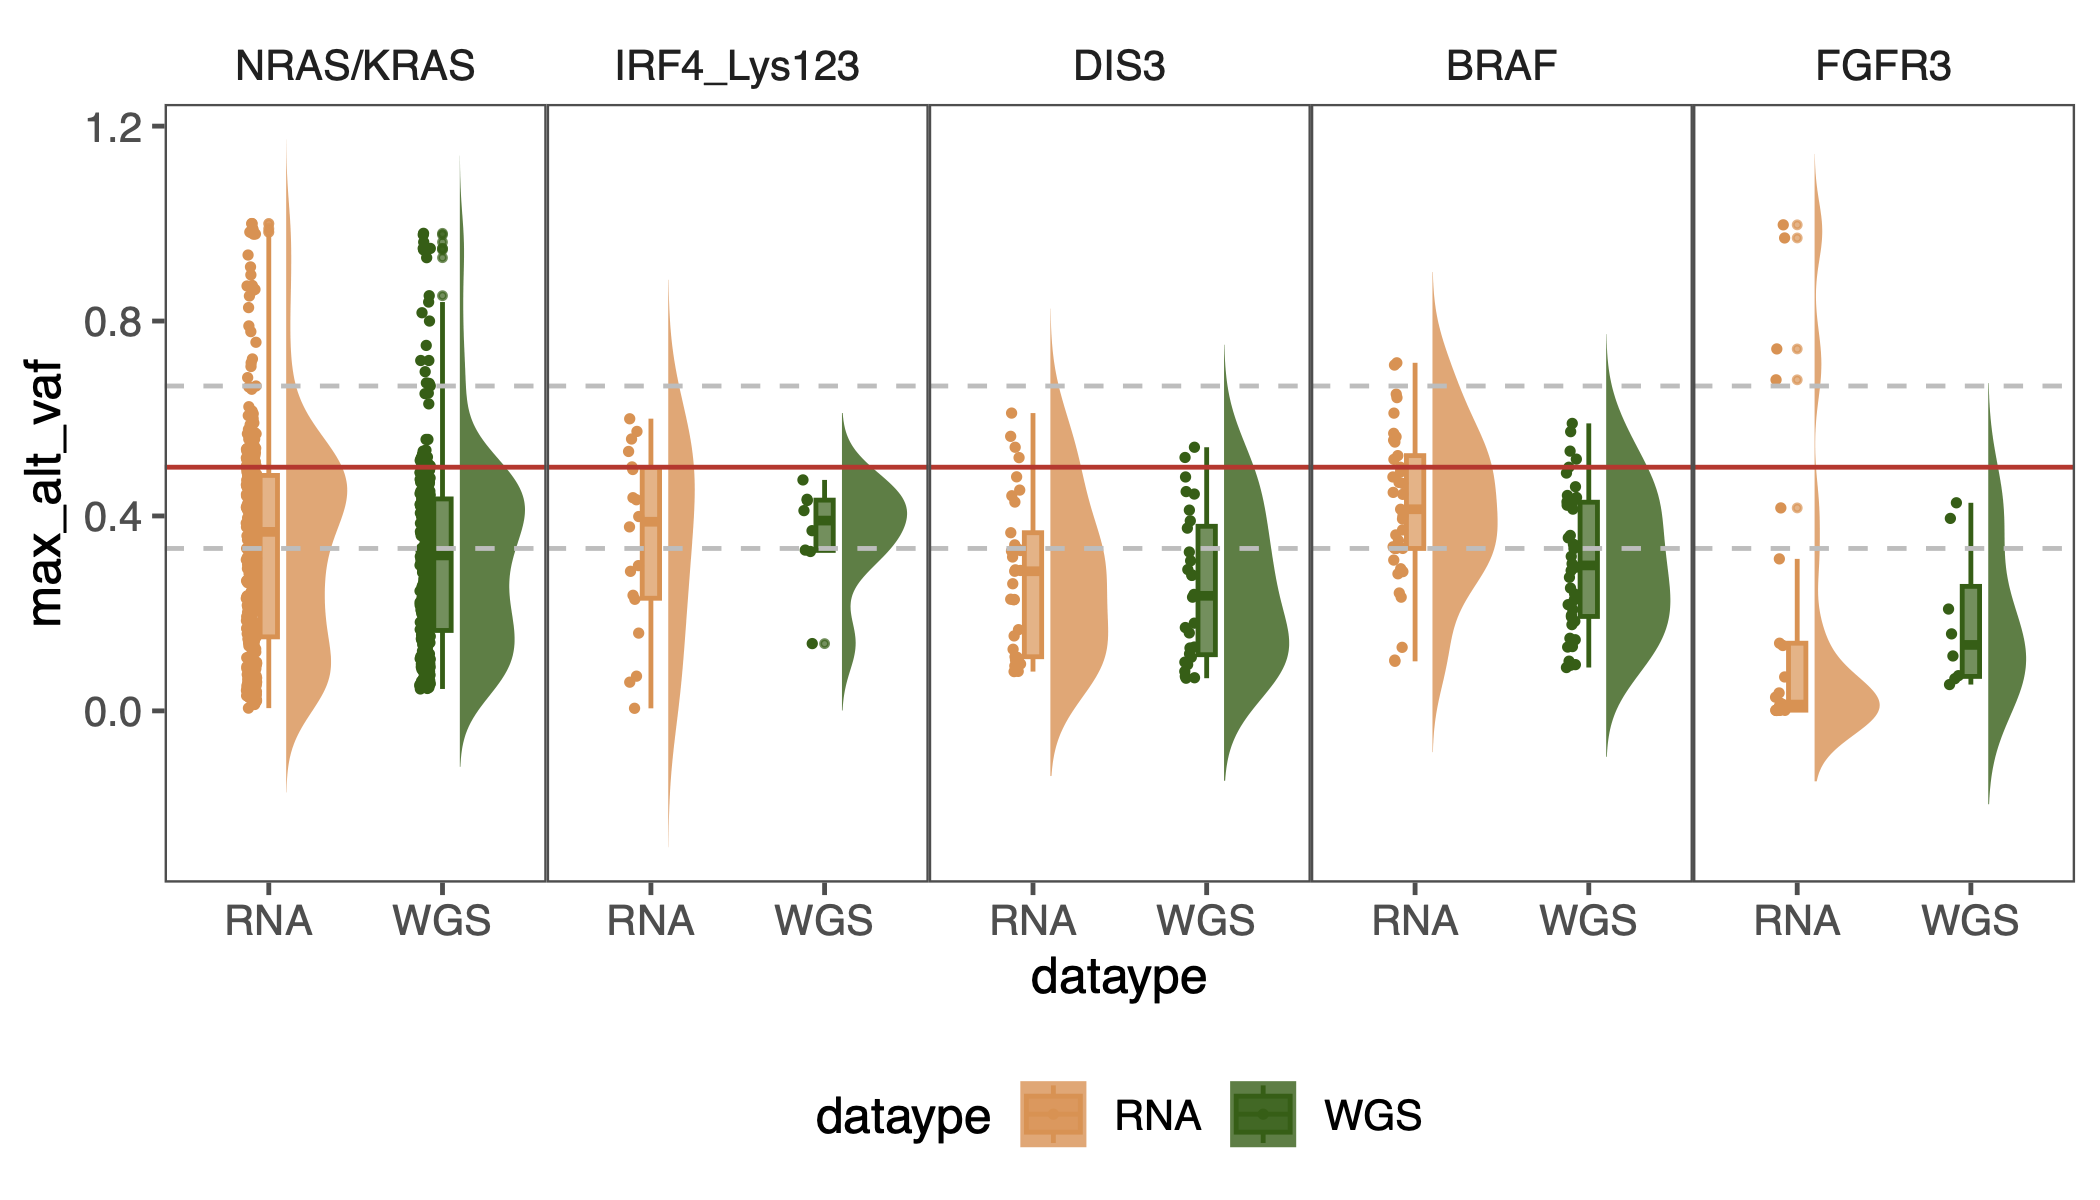
for(j in unique(summary_all_mutation$mutation_type)){
  j0 <- str_replace_all(j, pattern = "/", "_")
  pdf(glue("split_{j0}_point.pdf"))
  print(summary_all_mutation |>
          dplyr::filter(mutation_type == {{j}}) |>
          pivot_wider(id_cols = c(sample_id, small_label, mutation_type),
                      names_from = dataype, values_from = max_alt_vaf) |>
          na.omit() |>
          arrange(desc(mutation_type)) |>
          ggplot(aes(x = RNA, y = WGS, color = mutation_type)) +
          geom_point() +
          geom_smooth(method = "lm", se = FALSE) +
          scale_color_manual(values = c("NRAS/KRAS" = "#D1352B", "IRF4_Lys123" = "#035e03",
                                        "FGFR3" = "#EE934E", "DIS3" = "#1E90FF","BRAF" = "#5653a5",
                                        "others" = "grey")) +
          theme_few() +
          theme(
            legend.position = "bottom"
          )
  )
  dev.off()

  mycolor <- c("RNA" = "#EE934E", "WGS" = "#035e03")
  pdf(glue("split_{j0}_box.pdf"))
  print(
    ggplot(summary_all_mutation |>
             dplyr::filter(mutation_type == {{j}}) |>
             mutate(dataype = factor(dataype, levels = unique(dataype))),
           aes(x=dataype,
               y=max_alt_vaf,
               fill=dataype,
               color=dataype)) +
      scale_color_manual(values=rev(mycolor)) +
      scale_fill_manual(values=rev(mycolor)) +
      geom_half_violin(position = position_nudge(x = 0.1, y = 0),
                       side = 'R', adjust = 1.2, trim = F, color = NA, alpha = 0.8) +
      geom_point(aes(x = as.numeric(dataype) - 0.1,
                     y = max_alt_vaf,
                     color = dataype),
                 position = position_jitter(width = 0.03),size = 3, shape = 20) +
      # geom_boxplot(outlier.shape = NA, width = 0.1, alpha = 0.7) +
      geom_boxplot(outlier.shape = NA, width = 0.1, alpha = 0.7) +
      geom_hline(yintercept = 0.5, color = "#D1352B") +
      geom_hline(yintercept = c(0.333333, 0.666666), linetype = "dashed", color = "grey") +
      theme_few() +
      theme(
        legend.position = "bottom"
      )
  )
  dev.off()
}

for(i in small_label_all){
  summary_all_mutation <- all_mutation |>
    dplyr::filter(small_label == {{i}}) |>
    group_by(sample_id, dataype) |>
    summarise(
      max_alt_vaf = max(max_alt_vaf)
    ) |>
    ungroup()

  pdf(glue("{i}_points.pdf"))
  print(summary_all_mutation |>
          pivot_wider(id_cols = sample_id, names_from = dataype, values_from = max_alt_vaf) |>
          na.omit() |>
          ggplot(aes(x = RNA, y = WGS)) +
          geom_point())
  dev.off()
  mycolor <- c("RNA" = "#EE934E", "WGS" = "#035e03")
  pdf(glue("{i}_box.pdf"))
  print(
    ggplot(summary_all_mutation |> mutate(dataype = factor(dataype, levels = unique(dataype))),
           aes(x=dataype,
               y=max_alt_vaf,
               fill=dataype,
               color=dataype)) +
      scale_color_manual(values=rev(mycolor)) +
      scale_fill_manual(values=rev(mycolor)) +
      geom_half_violin(position = position_nudge(x = 0.1, y = 0),
                       side = 'R', adjust = 1.2, trim = F, color = NA, alpha = 0.8) +
      geom_point(aes(x = as.numeric(dataype) - 0.1,
                     y = max_alt_vaf,
                     color = dataype),
                 position = position_jitter(width = 0.03),size = 3, shape = 20) +
      # geom_boxplot(outlier.shape = NA, width = 0.1, alpha = 0.7) +
      geom_boxplot(outlier.shape = NA, width = 0.1, alpha = 0.7) +
      geom_hline(yintercept = 0.5, color = "#D1352B") +
      geom_hline(yintercept = c(0.333333, 0.666666), linetype = "dashed", color = "grey") +
      theme_few() +
      theme(
        legend.position = "bottom"
      )
  )
  dev.off()
}