library(MMyeloMap)
testpath <- path_package("MMyeloMap", "extdata/files/quant.sf.gz")
fs::dir_create("test")
generate_qmd_from_template(testpath,
                           "pmm03",
                           "test/out.qmd")
quarto_render("test/out.qmd")29 The MMyeloMap R package
To distill the key patterns embedded in the large-scale transcriptomic dataset generated in this study and to support downstream research, we developed multiple predictive models based on diverse machine learning algorithms. These models were trained on the integrated dataset described in this work. To assess their performance and identify the most reliable classifier for subtype prediction, we incorporated an independent external cohort and processed it using the same analytical pipeline. Predictions from each model were compared against subtype assignments derived from standard clustering procedures. This comparison enabled the identification of the optimal model, which demonstrated high predictive accuracy. Building on these results, we assembled a suite of molecular profiling tools for multiple myeloma (MM), which have been packaged into an R toolkit, MMyeloMap, supporting comprehensive, single-sample subtype inference.
29.1 Getting started with MMyeloMap
By taking Salmon-quantified gene expression data from bulk RNA-seq as input, a comprehensive sample prediction report can be obtained by running the following code. Selected components of html report are illustrated in our subsequent sections:
29.2 Subtype prediction of query sample
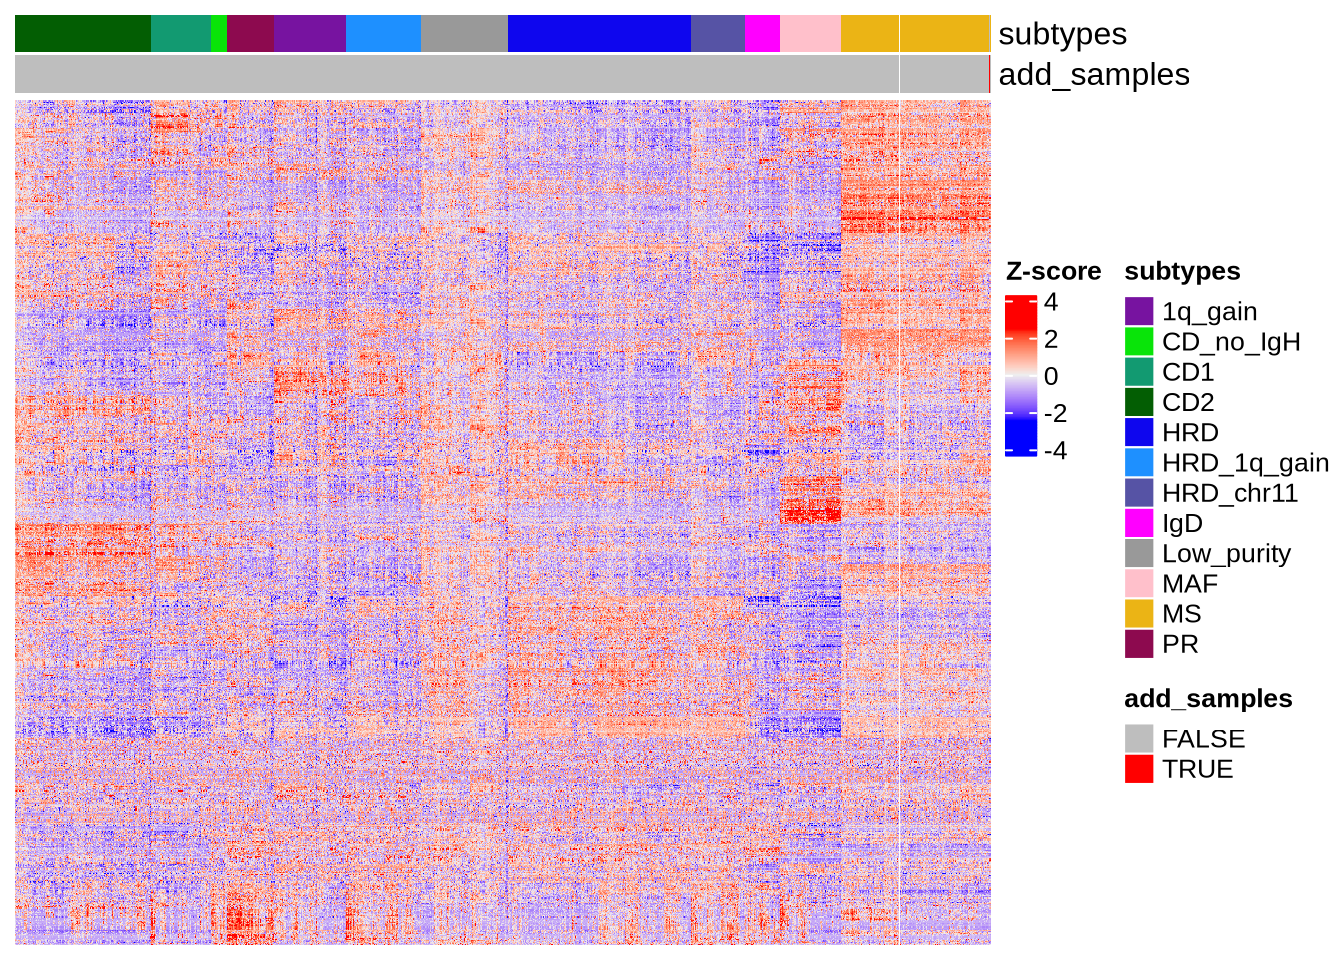
Our R package operates in two main steps. First, based on transcriptomic features, the subtypes of query sample is predicted and visualized using an interpolated heatmap and umap, as shown below:
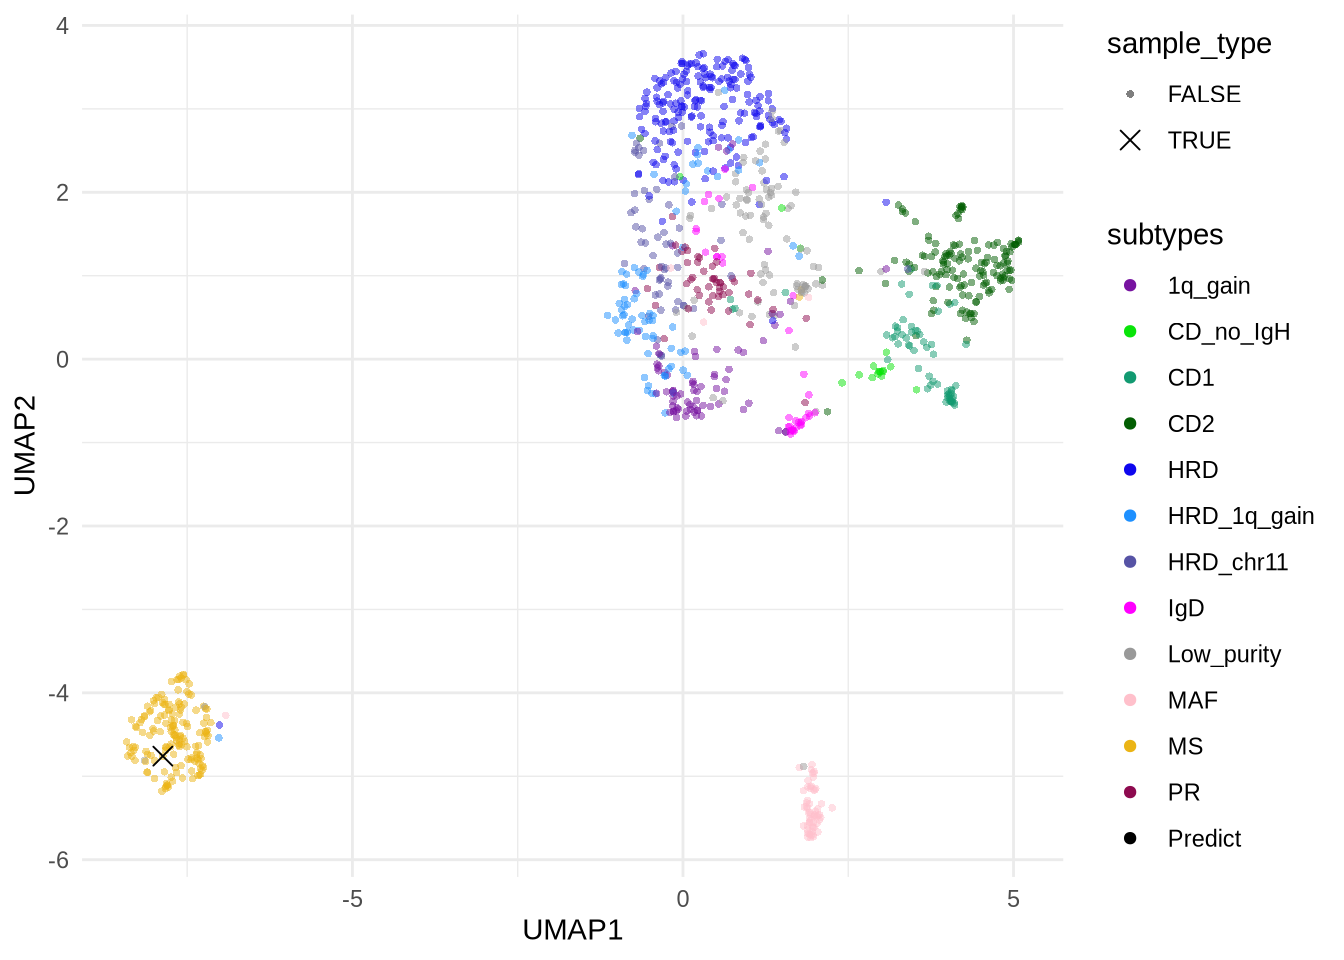
The UMAP visualization of the sample distribution is shown below, with the queried sample marked by a cross (✕):
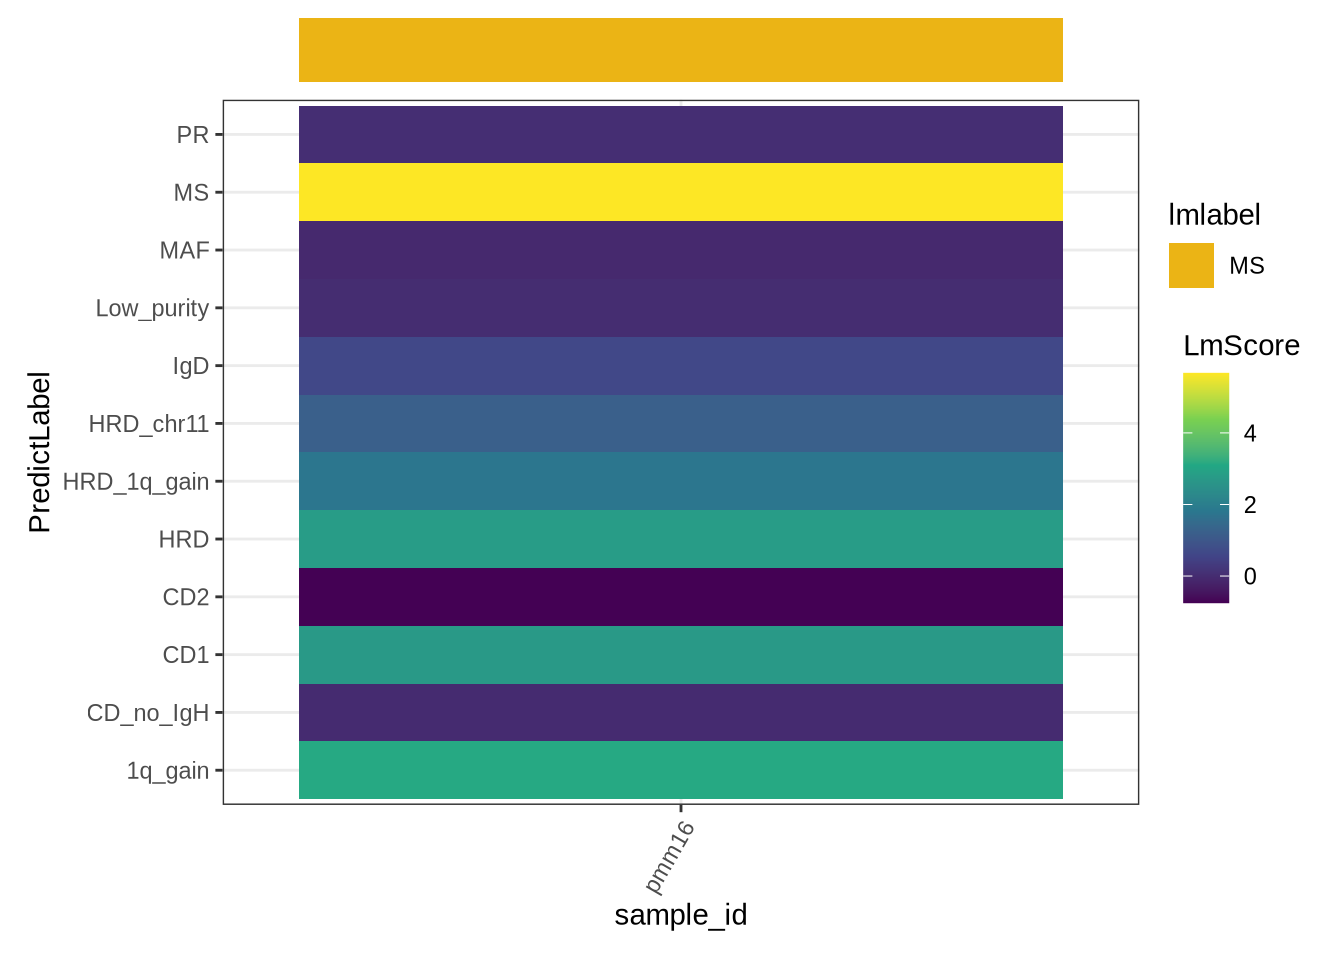
The following figure shows the predicted subtype of the query sample inferred by linear model:
Meanwhile, our R package also provides multiple models for cross-validation and performance comparison. The following figure shows the predicted subtype of the query sample inferred by the XGBoost model:

29.3 Survival prediction module
The second component of MMyeloMap package is designed for relapse risk prediction: by integrating subtype assignments from Step 1 with baseline transcriptomic feature expression, the model generates personalized risk scores for query samples.
The pieplot shows the risky score and survival prediction of new sample:

29.4 Other available predictions
Additionally, the MMyeloMap package provides IG subtype classification and sample sex prediction as auxiliary outputs for reference
The heatmap visualizing the expression profiles of sex-associated genes of the query sample:

The stackplot visualizing the Immunoglobulin subtype probabilities for the query sample:
